
1
The Newton Works graphing calculator program lets you perform calculations and
display the results in a graph or table. You can copy and paste the calculations or
graph into other programs using Newton Works commands. To learn about Newton
Works, see the chapters on Newton Works in the
Apple eMate 300 User's Manual.
Creating a new document for calculations
To create a new document in which to do calculations, do the following from inside
Newton Works:
1
Tap New.
2
In the list that appears, tap Calculations.
A blank document and a title slip appear.
1
Introduction
3
If desired, type in a title for the calculation document.
Note: This title doesn't appear when you print a calculation document.
4
Press Return or tap
X.
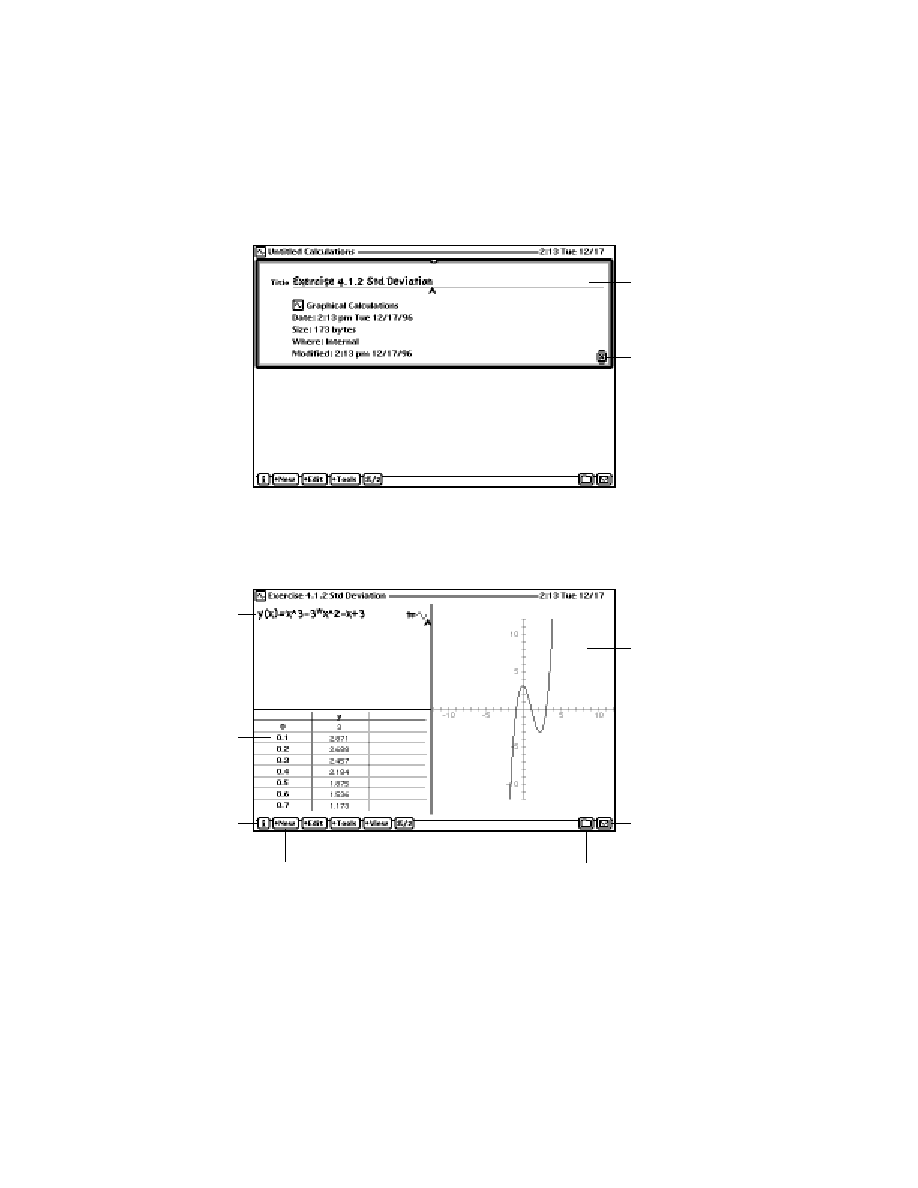
Here's an example of a typical calculation document.
2
Chapter 1
If you plot the
calculation, it
appears here.
Enter the calculations
in the math window.
View the output in
tabular format.
Tap the Routing button
to print, send, duplicate,
or delete a calculation
document.
Tap New to create a new
calculation document.
Tap the Folder button to file
the calculation document
into a folder.
If desired, type a title here.
Whe
n you're finished, tap
here or pr
ess Return.
Tap the Information
button to get help, set
preferences, or find
out more about the
graphing calculator
application.
Setting preferences
You can set preferences for the graphing calculator. You can choose the default
measurement to use for angles and the default number format.
You can enter numbers in the way they're typically expressed, with digits to the left
and right of the decimal. For example,
123.4567
�4.32
You can also enter scientific or engineering notation. For example,
1.234567E2
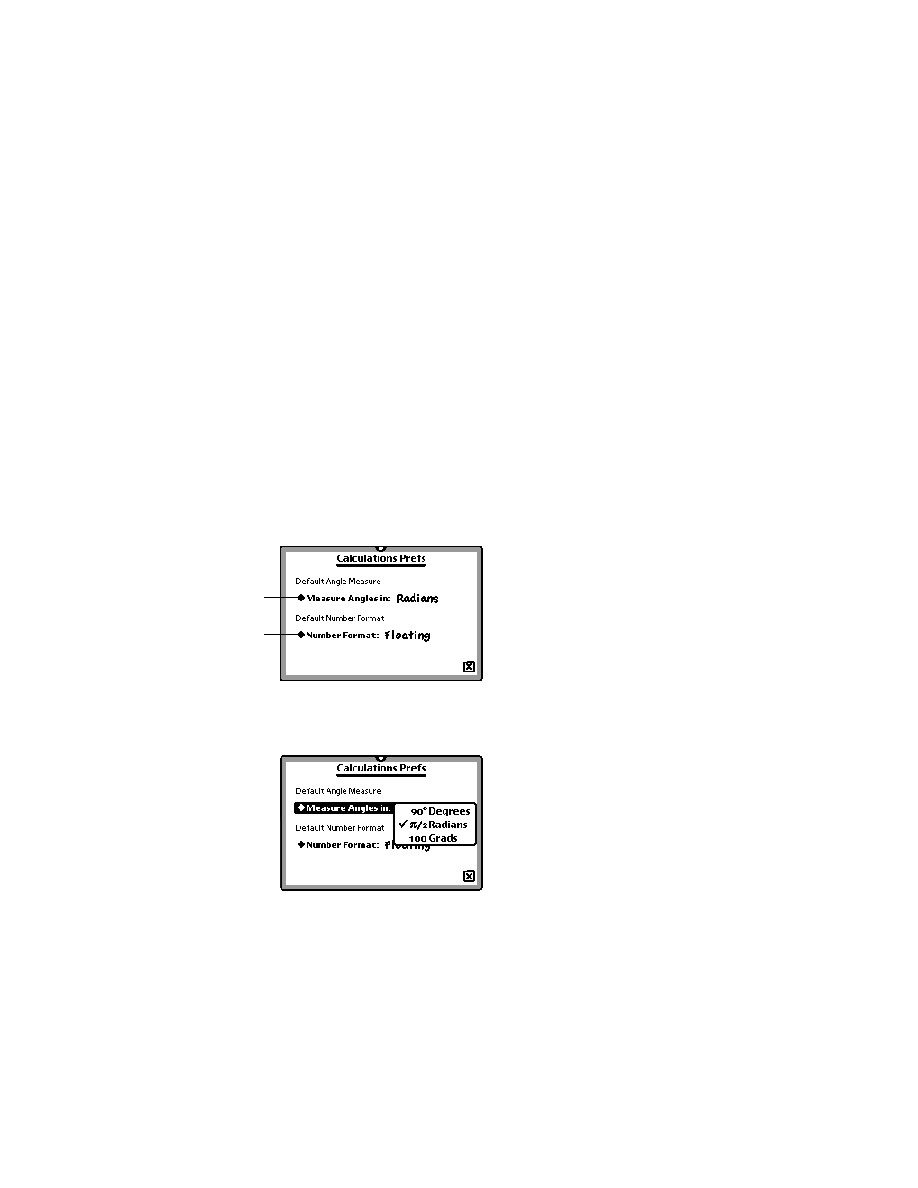
To set the default number format for new calculation documents, follow these steps:
1
Tap the Information button
;, then tap Calculations Prefs.
The Calculations Prefs slip appears.
2
Tap "
u Measure Angles in" and in the list that appears, tap your choice.
Introduction
3
Tap here and in the
list that appears,
tap a default format
.
Tap here and in the
list that appears,
tap a default
measurement.
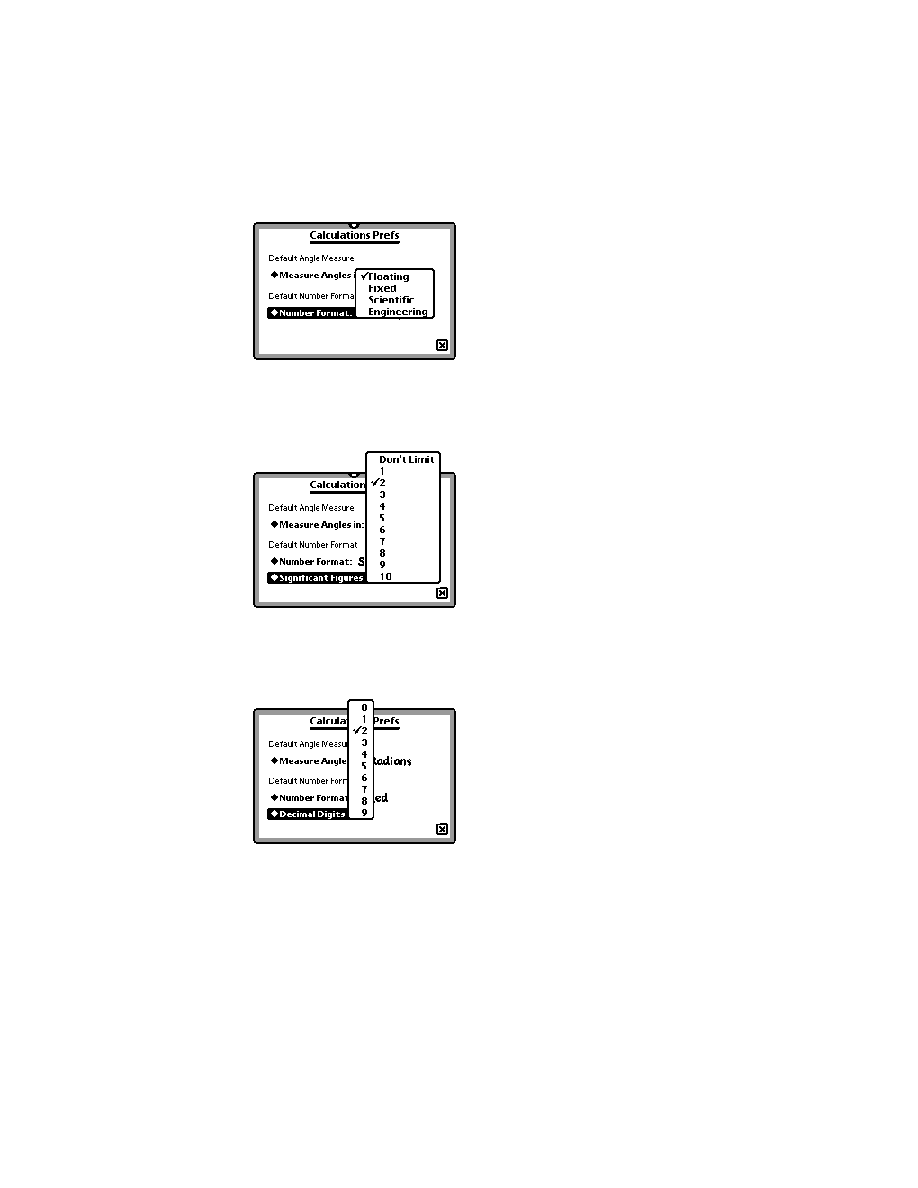
3
Tap
u Number Format and in the list that appears, tap your choice.
4
If you choose Scientific or Engineering, tap
u Significant Figures and in the list that
appears, tap your choice.
5
If you choose Fixed, tap
u Decimal Digits and in the list that appears, tap your
choice for the number of digits you want after the decimal point.
4
Chapter 1
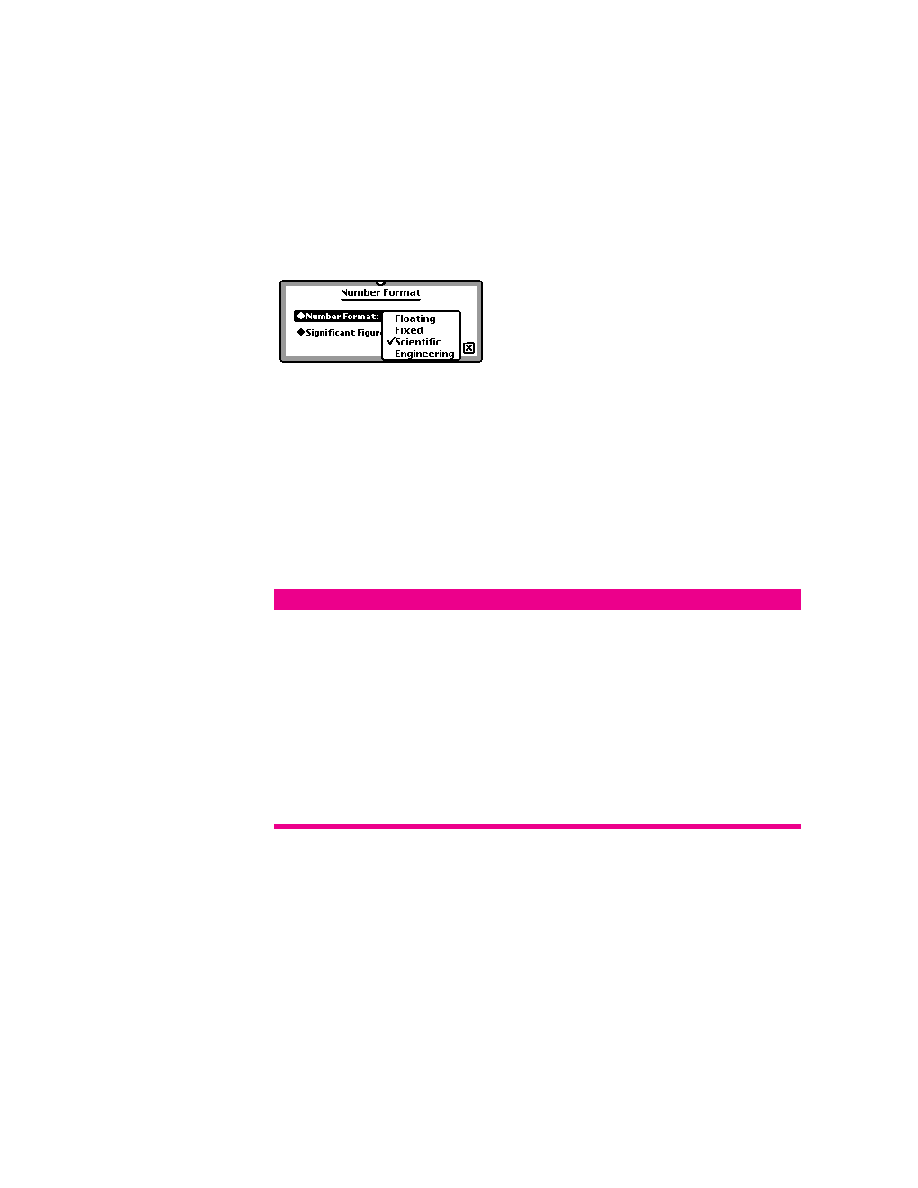
To change the number format for the open calculation document follow these steps:
1
Tap Tools, then tap
u Number Format.
2
Tap
u Number Format and in the list that appears, tap your choice.
3
If you choose Scientific or Engineering, tap
u Significant Figures, then tap the
number of significant digits to be displayed.
4
If you choose Fixed, tap
u Decimal Digits and in the list that appears, tap your
choice for the number of digits you want after the decimal point.
Using operators
You can use the following operators in your calculations:
For
Type this
Example
Addition
+
3 + 4
Subtraction
�
10 � 3
Multiplication
* (or a space)
43 * 2
Division
/
8/2
Absolute value
||
|x|
Factorial
!
36!
Power
^
2^3
Tip: You don't need to type the multiplication symbol (*) before an expression. A
number before a symbol or a space between symbols is interpreted as multiplication.
For example:
3sin(x) is interpreted as 3 multiplied by the sine of x.
Introduction
5

x y z is interpreted as x multiplied by y, then that product multiplied by z.
Use parentheses to avoid ambiguity about the order of calculations. The expressions
in parentheses are solved first.
For example, if you type:
3*(4+6)
then the calculation 4 + 6 will be performed first.
For more information, see "Order of Evaluation," next.
Order of evaluation
The graphing calculator evaluates calculations in the following order:
m Calculations inside parentheses. For example, in the expression 3 * (4 + 6), 4 + 6
is evaluated first and the result (10) is multiplied by 3.
m Functions, such as sin or log
m Factorials (evaluated left to right)
m Exponent operator (evaluated right to left)
m Unary minus (for example, �a)
m Multiplication and division (evaluated left to right). For example, in the expression
2 + 3 * 6, 3 * 6 is evaluated first.
m Addition and subtraction (evaluated left to right)
6
Chapter 1
Viewing the results
To see the results of your calculation, do one of the following:
m Tap Tools and then tap Evaluate.
m Press Enter.
m Press x-Return.
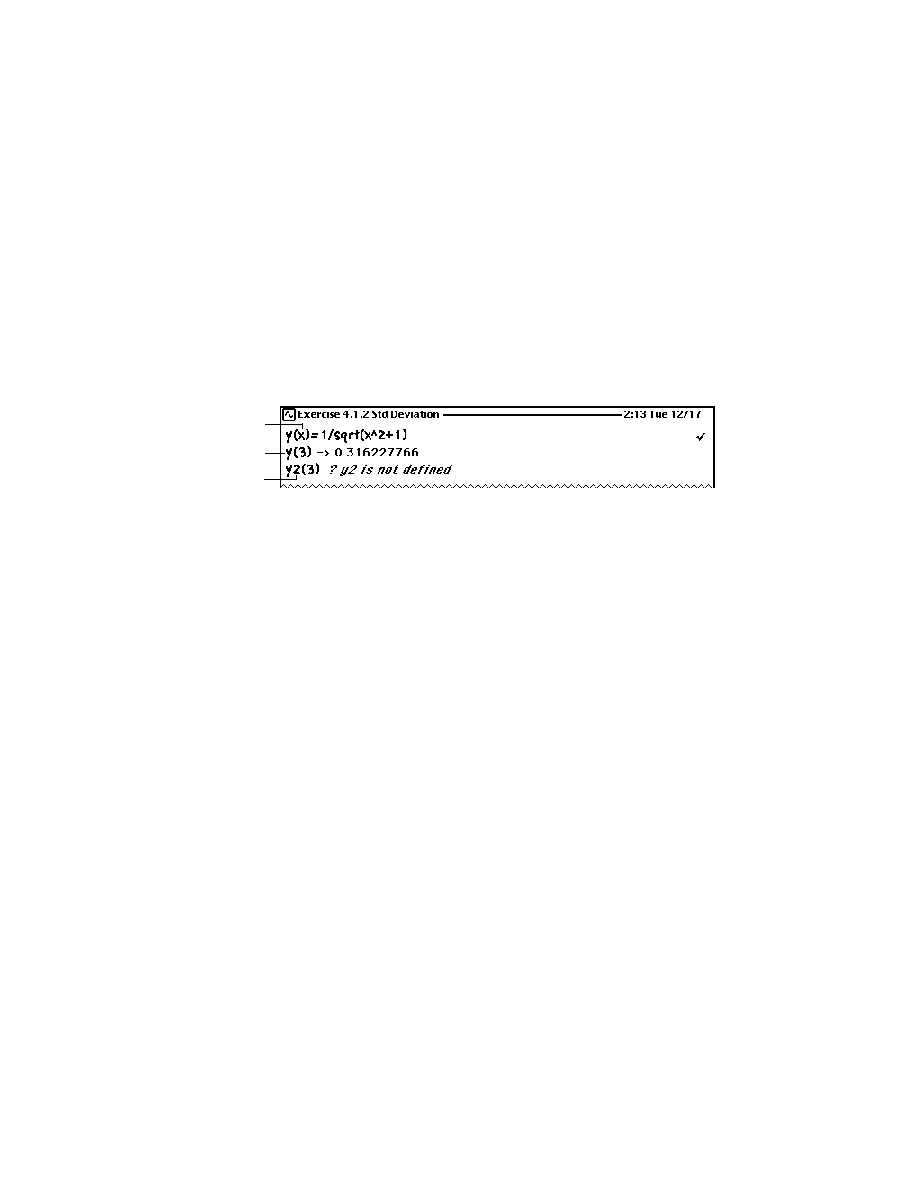
The results of your calculation appear. A checkmark appears at the right of the
calculation area if you are defining a variable or function. If any errors are found, an
error message appears.
Correcting mistakes
If you make a mistake, you can correct it by doing one of the following. (To learn
how to perform these actions, see the documentation that came with your
Newton device.)
m Position the caret to the right of the information you want to delete and press the
Delete key.
m Scrub out the information you want to delete.
m Select the information you want to delete and press the Delete key.
Note: Error messages and results are automatically deleted when you edit the line
they are located on.
Clearing the display
To clear all calculations from a graphing calculator document, do the following:
1
Select all the calculations by pressing
x-A. (Or tap Edit then tap Select All.)
2
Tap Edit, then tap Clear (or press Delete).
Introduction
7
calculation
function
error
Saving a calculation document
Like other Newton Works documents, your calculation document is automatically
saved as you enter information. There is no save command or button.
For more information on Newton Works, see the chapters on Newton Works in the
Apple eMate 300 User's Manual.
Filing a calculation document
If you are using the full Newton System, you can file calculation documents into
folders using the Folder button. When you create a new calculation document, it is
automatically stored in the current folder you are viewing. You can file calculation
documents into other folders at any time.
Note: If you are using your eMate in Classroom Mode, you can't file items
into folders.
1
Go to the calculation document you want to file.
2
Tap the Folder button
F.
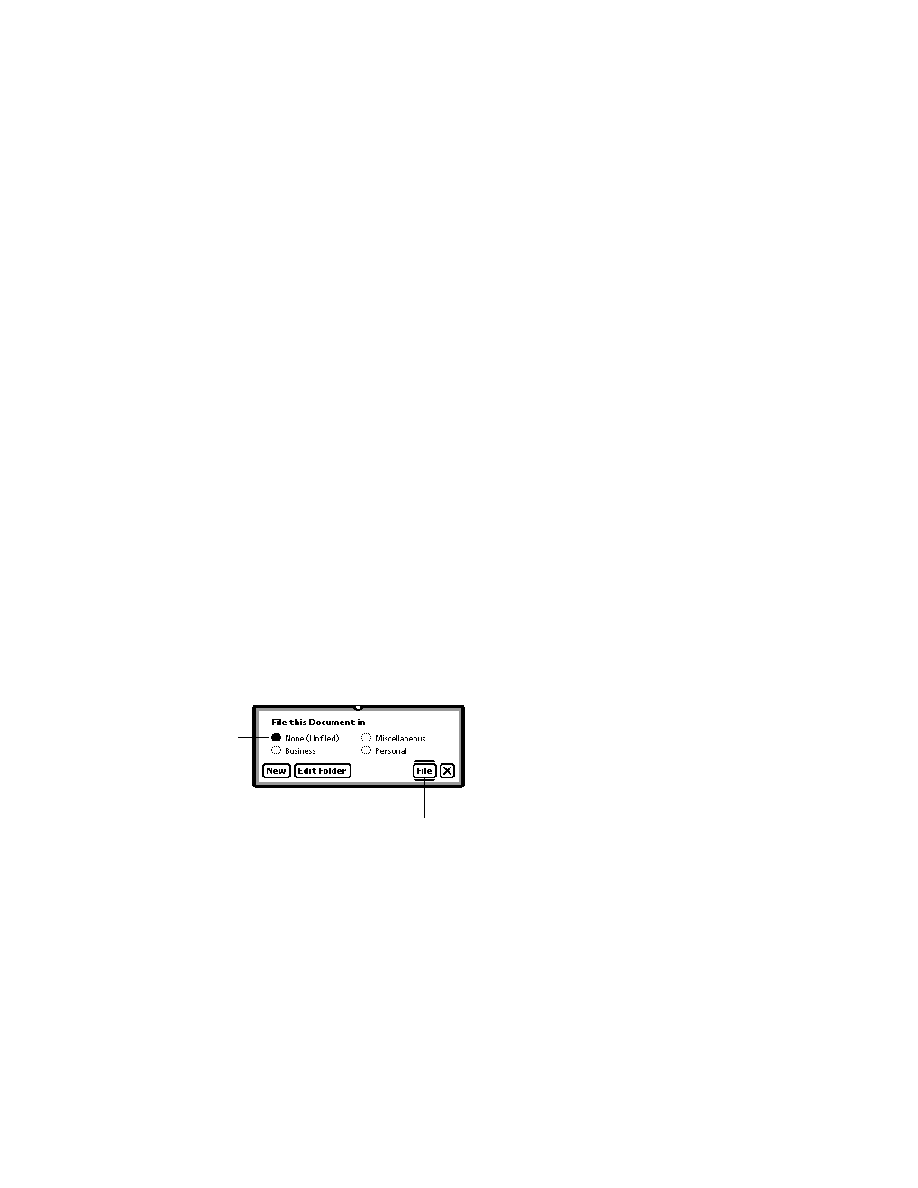
The folder slip appears.
3
Tap the name of the folder you want the item to be stored in, then tap File.
If you move a document to a folder you're not currently viewing, the document will
disappear from your screen.
For more information on filing a document (or multiple documents), see the chapter
on organizing information in the
Apple eMate 300 User's Manual.
8
Chapter 1
When you're ready, tap File.
Tap the name of the
folder where you
want to file the item.
Viewing your calculation documents
You may want to see a list of all the calculation documents you created, especially if
you're trying to find a particular document.
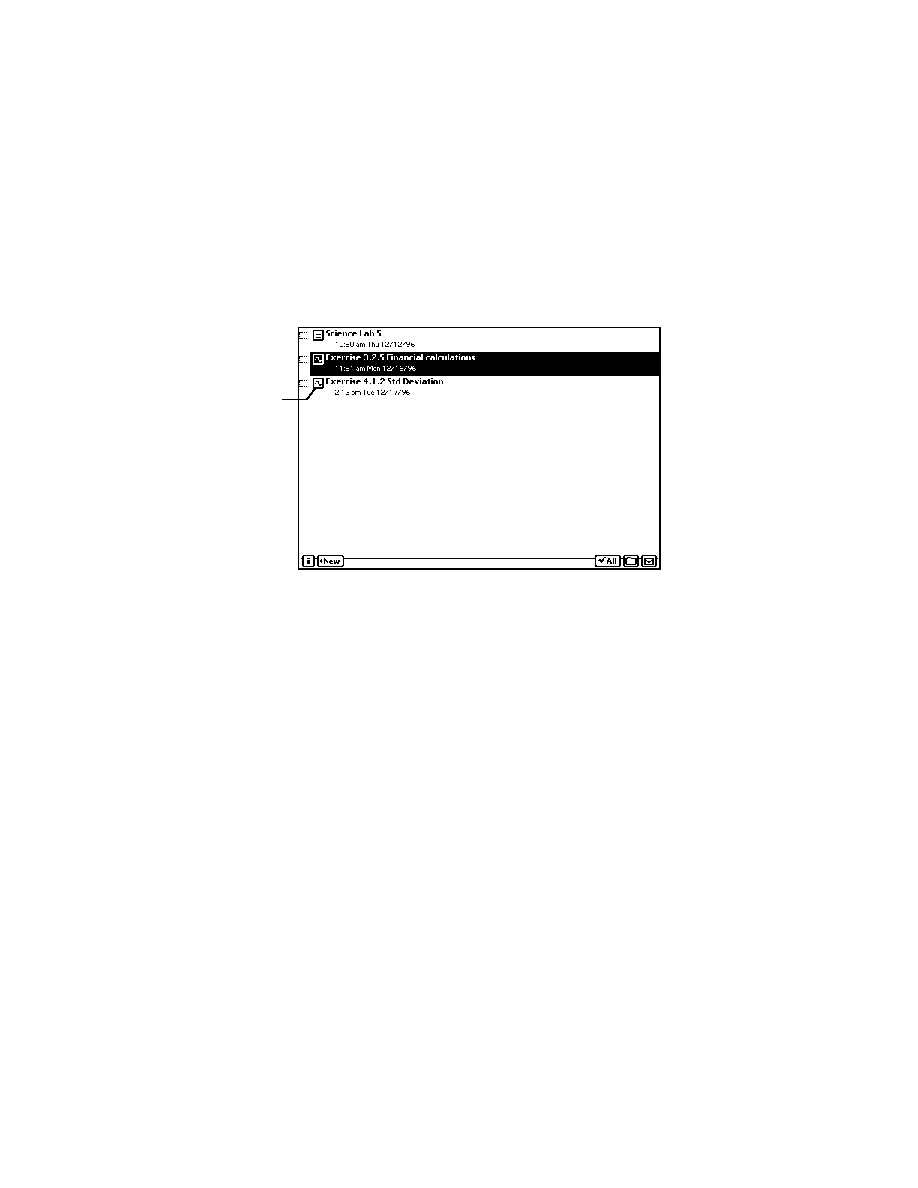
m To see a list of items press Overview.
An overview appears.
m Press Scroll Up or Scroll Down or the Up and Down Arrow keys on your keyboard
to move up and down in the list.
m If desired, tap an item in the list to go to it.
Printing, beaming, and faxing
You can print, fax, and beam calculation documents. For more detailed information,
see the chapter on printing, faxing, and beaming in the
Apple eMate 300
User's Manual.
Reinstalling the
Newton Works graphing calculator software
If you inadvertently delete the Newton Works graphing calculator, you can reinstall
the software using the
eMate Connectivity CD that came with your eMate. For more
information, see the documentation that came with the CD, and the documentation
that came with the Newton Connection Utilities software.
Introduction
9
This symbol represents
calculation documents.


11
This chapter describes how to use the built-in functions of the graphing calculator
and how to create your own functions and variables.
Using the built-in functions
The graphing calculator has several built-in functions that you can use with your
calculations. These functions are grouped as follows:
m Integer
m Math
m Trigonometry
m Series
m Hyperbolic
m Financial
You can enter functions by typing function names on the keyboard or by selecting the
functions from a list.
2
Using Functions and Variables
To use any of the built-in functions, do one of the following:
m Type the function name on the keyboard, or
1
Tap Tools, and then tap Functions.
The function slip appears. ( Your slip may not look exactly like the illustration.)
2
Tap the diamond
u at the top of the slip.
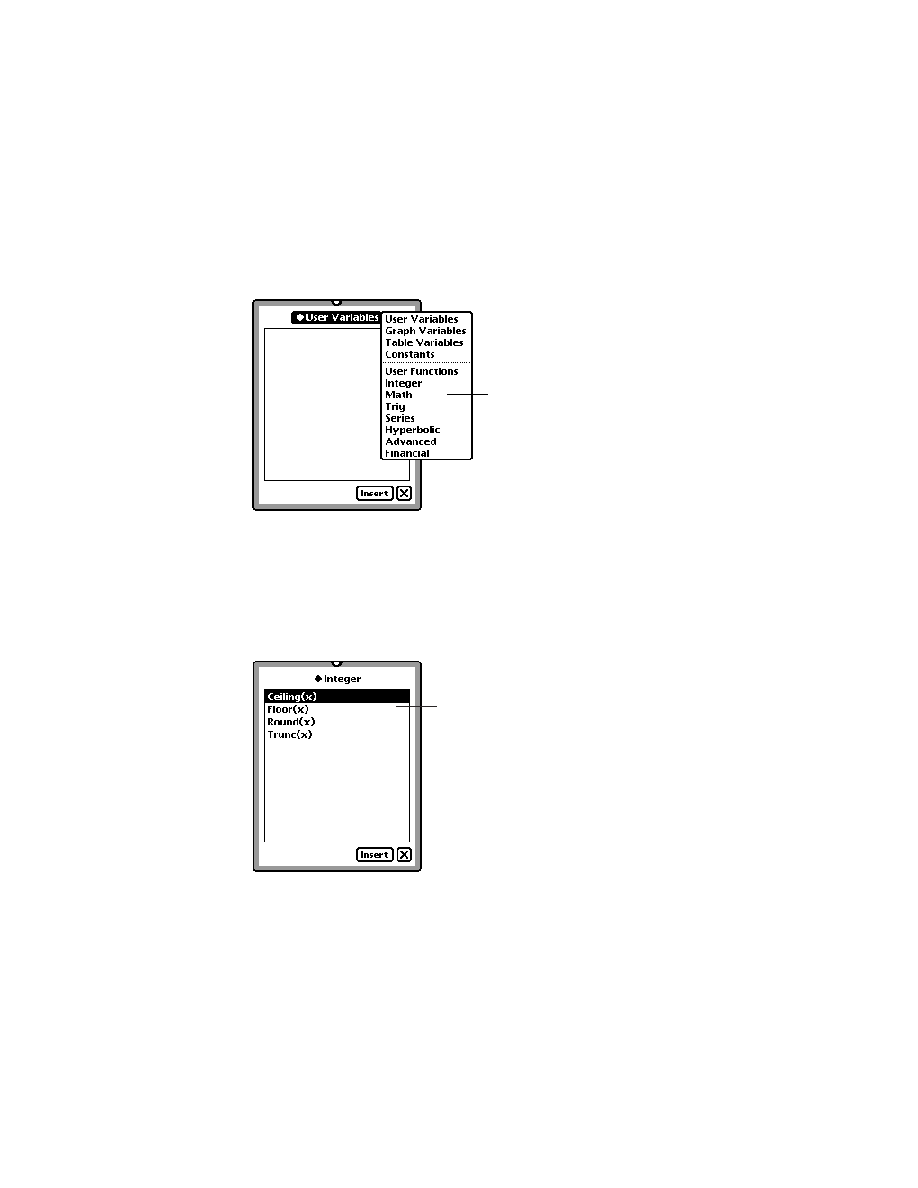
3
In the list that appears, tap the type of function you want (Integer, Math, Trig, Series,
Hyperbolic, Advanced, or Financial).
Functions of that type are shown.
12
Chapter 2
Tap the function category you want.
Functions appear in this area.

4
Tap the function that you want to use in your calculation, then tap Insert.
The function appears and the caret is placed between the parentheses.
5
If desired, tap
X to close the function slip.
6
Enter the arguments for the function.
Using the integer functions
The Integer list contains the following functions:
Function
Abbreviation
Description
Ceiling
Ceiling(x)
Returns the smallest integer greater than x
Floor
Floor(x)
Returns the largest integer less than x
Round
Round(x)
Returns the nearest integer to x (rounds to even
integers on x.5 values)
Truncate
Trunc(x)
Returns the numbers to the left of the
decimal point of x
Examples
y(x) = Ceiling(2.3x+3.6)
y(x) = Round(3*x/4)
mymodulus(x,y) = x�y*Trunc(x/y)
Using Functions and Variables
13

Using the math functions
The Math list contains the following functions:
Function
Abbreviation
Description
Square Root
Sqrt(x)
Returns the square root of x
Natural logarithm
Ln(x)
Returns the natural logarithm of x
Exponential
Exp(x)
Returns the exponential (inverse of the
natural logarithm) of x
Gamma
Gamma(x)
Returns the gamma of x (Factorial(x � 1) for
positive integers)
Logarithm
Log(x)
Returns the logarithm of x, base 10
Modulus
Mod(x,y)
Returns the modulus of x with respect to y
(that is, the remainder of x/y)
Remainder
Remainder(x,y)
Returns x � y * round(x/y)
Factorial
Factorial(x)
Returns the factorial of x
Using the Remainder function
The Remainder function is not simply the remainder of x/y (the modulus function is).
The Remainder function returns x � y * round(x/y). A different definition is
x � remainder(x,y), which gives the closest value to x that is evenly divisible by y.
Examples
y(x) = 0.5*ln((1+x)/(1�x))
y(x) = 1/sqrt(4*x^2+1)
y(x) = exp(x)/(1�exp(2*x))
14
Chapter 2
Using the trig functions
The Trig list contains the following functions:
Function
Abbreviation
Description
Cosine
Cos(x)
Returns the cosine of x
Sine
Sin(x)
Returns the sine of x
Tangent
Tan(x)
Returns the tangent of x
Arc cosine
ArcCos(x)
Returns the inverse cosine (arc cosine) of x
Arc sine
ArcSin(x)
Returns the inverse sine (arc sine) of x
Arc tangent
ArcTan(x)
Returns the inverse tangent (arc tangent) of x
Examples
5cos(.5)
y(x) = sin(x�
/2)
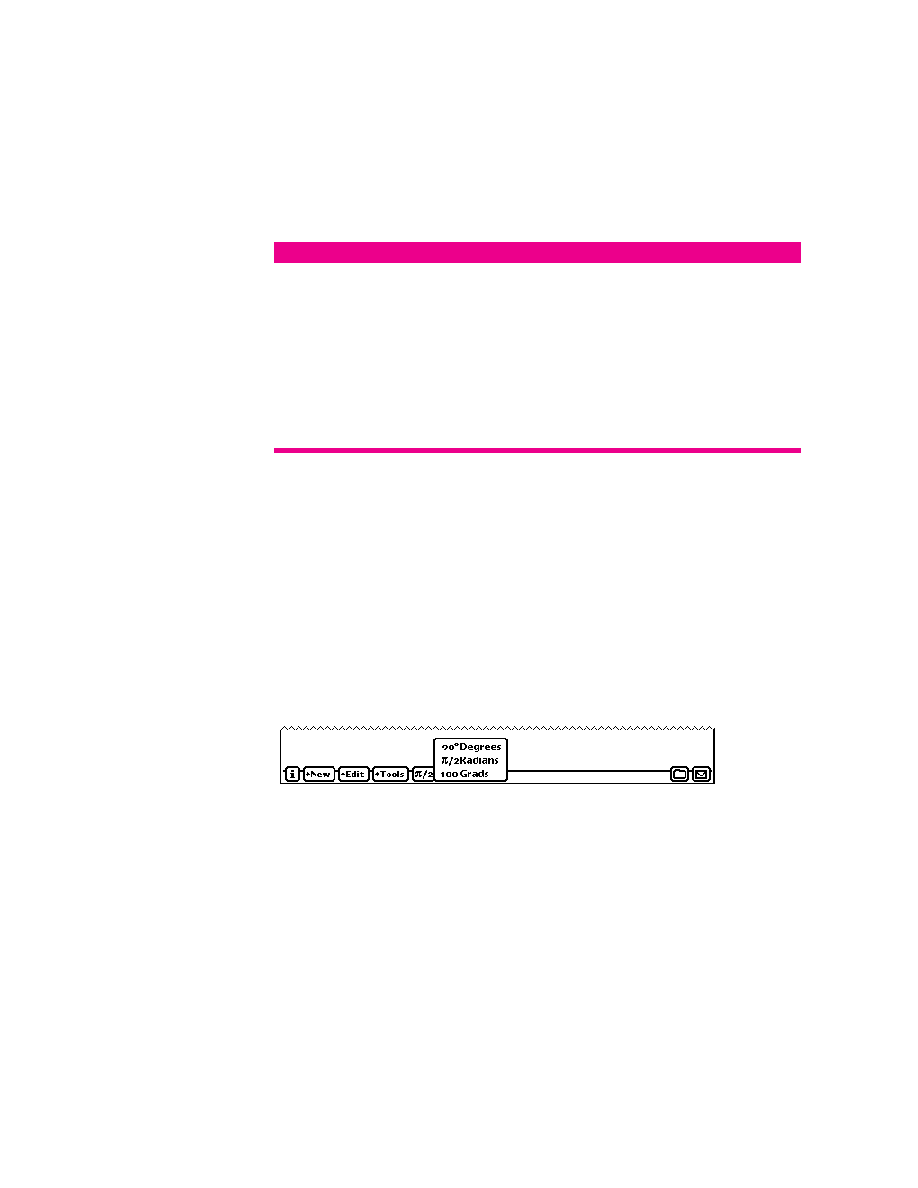
Changing the measured angle
By default, trigonometric arguments are interpreted as radians. To use degrees
or gradients, follow these steps:
1
Tap measured angle.
2
Tap the desired measurement from the list.
Graphs and tables are updated automatically when you change the angle. Results in
the math window are not automatically updated.
Using Functions and Variables
15

Using the series functions
The Series functions perform operations on lists. The Series list contains the
following functions:
Function
Abbreviation
Description
Summation
Sum(list)
Returns the sum of the entries in the list
Minimum
Min(list)
Returns the smallest value in the list
Maximum
Max(list)
Returns the largest value in the list
Mean
Mean(list)
Returns the arithmetic mean
Median
Median(list)
Returns the median
Mode
Mode(list)
Returns the value that occurs most
frequently in the list, or multiple values if they
occur with equal frequency
Variance
Variance(list)
Returns the mean of the squared deviations
Standard deviation
StDev(list)
Returns the positive square root of the
variance
Sort
Sort(list)
Sorts the entries in the list from smallest
to largest
Size
Size(list)
Returns the number of elements in the list
Element
Element(list,index)
Returns the
indexth entry in the list
Note: index starts with 0 for the first entry
For more information on lists, see Chapter 4, "Creating and Using Lists."
Examples
y(x) = Sum([3,sin(x),trunc(x/2)])
element([1,2,3,4,5,6],2) -> 3
mean([0,1,2,3,4,5,6])
mode([0,0,1,2,3,4,5,5,6]) ->[0,5]
16
Chapter 2

Using the hyperbolic functions
The Hyperbolic list contains the following functions:
Function
Abbreviation
Description
Hyperbolic cosine
CosH(x)
Returns the hyperbolic cosine of x
Hyperbolic sine
SinH(x)
Returns the hyperbolic sine of x
Hyperbolic tangent
TanH(x)
Returns the hyperbolic tangent of x
Hyperbolic arc cosine
ArcCosH(x)
Returns the inverse hyperbolic cosine of x
Hyperbolic arc sine
ArcSinH(x)
Returns the inverse hyperbolic sine of x
Hyperbolic arc tangent
ArcTanH(x)
Returns the inverse hyperbolic tangent of x
Examples
y(x) = sinh(4x)*cosh(2x)
y(x) = tanh(sin(x))
y(x) = x*arcsinh(2x)
Using Functions and Variables
17

Using the financial functions
The Financial list contains the following functions:
Function
Abbreviation
Description
Annuity
Annuity(rate,periods)
Returns the present value of an annuity
(1 � (1 + r)^n)/r
Compound
Compound(rate,periods) Returns (1 + r)^n
Examples
Calculate your savings after two years if you deposited $3000 at 5.25% interest,
compounded annually.
3000*compound(.0525,2) -> 3323.27
Calculate the current principal if you've made 12 payments of $320 at a rate of 8.5%.
320*annuity(.085,12)
Creating your own functions
You can create functions and use functions that you define. Functions must have a
function name followed by the argument names in parentheses on the left side of the
equals sign and an expression on the right.
Note: You must enter a function name for each expression.
The following are examples of valid functions:
y(x)=sin(x�0.5*pi)
z(x)=sqrt(16�x^2)
r(t)=8cos(t)
p(t)=[4cos(t),3sin(t)]
qrts(a,b,c)=[(�b+sqrt(b^2�4a*c))/(2a),(�b�sqrt(b^2�
4a*c))/(2a)]
18
Chapter 2
x and t in the above examples are the function parameters. You specify the values
for these parameters when you use the function in a calculation. For example,
to evaluate the function
z(x)=sqrt(16�x^2)
with x = 2, type
z(2)
and
press Enter.
To create a function:
m Enter the function and press Enter.
If no errors are found, a checkmark appears to the right of your function and your
function is added to the Your Functions list. Functions are saved automatically. There
is no save command or button.
Using Functions and Variables
19
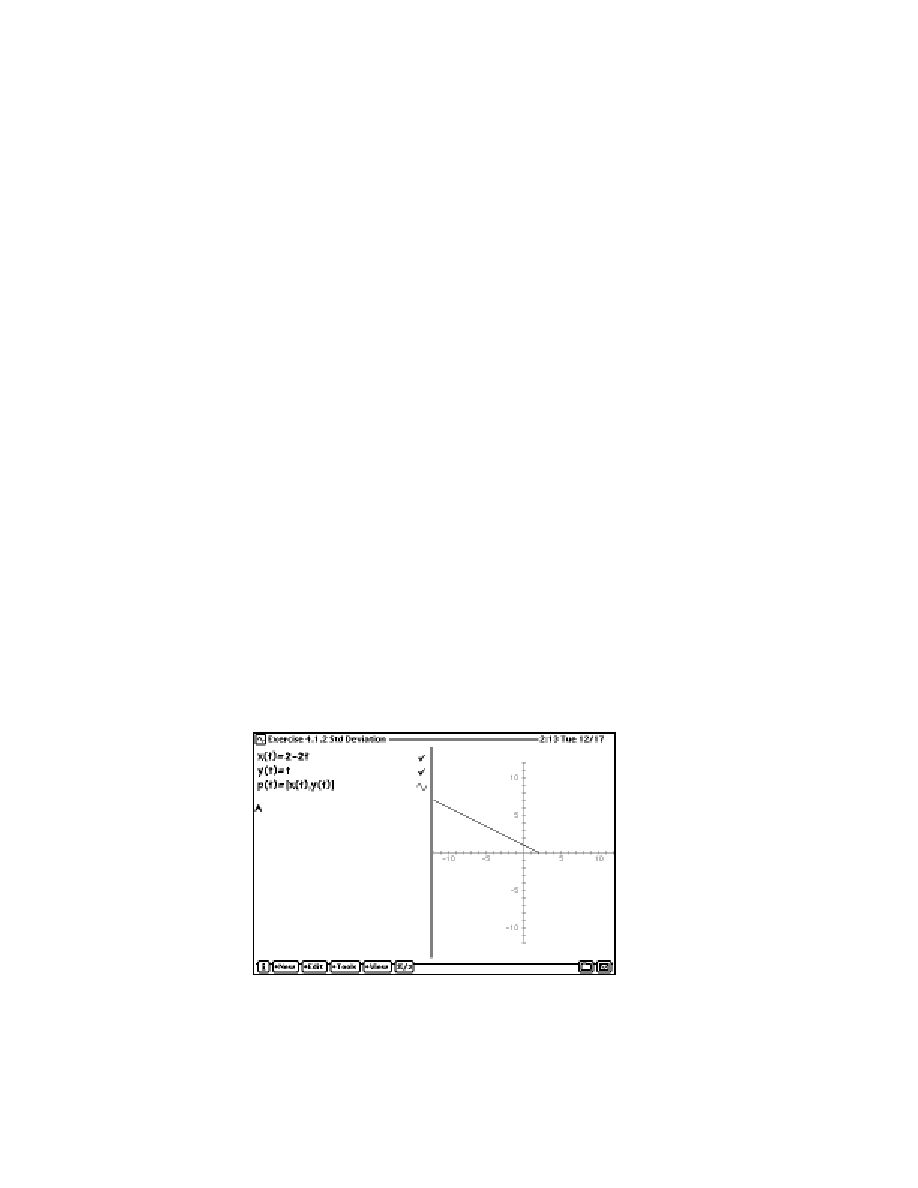
Creating parametric functions
An example of a parametric function is shown below:
x=t2, y=t�3
To enter parametric equations into the Newton Works graphing calculator, you can
use the following format:
x(t)=f(t)
y(t)=g(t)
p(t)=[x(t),y(t)]
or
p(t)=[f(t),g(t)]
For example, using the above parametric equation, you can enter:
x(t)=t^2
y(t)=t�3
p(t)=[x(t),y(t)]
or
p(t)=[t^2,t�3]
You can graph parametric functions or view the results in tabular format, just like any
other function.
20
Chapter 2
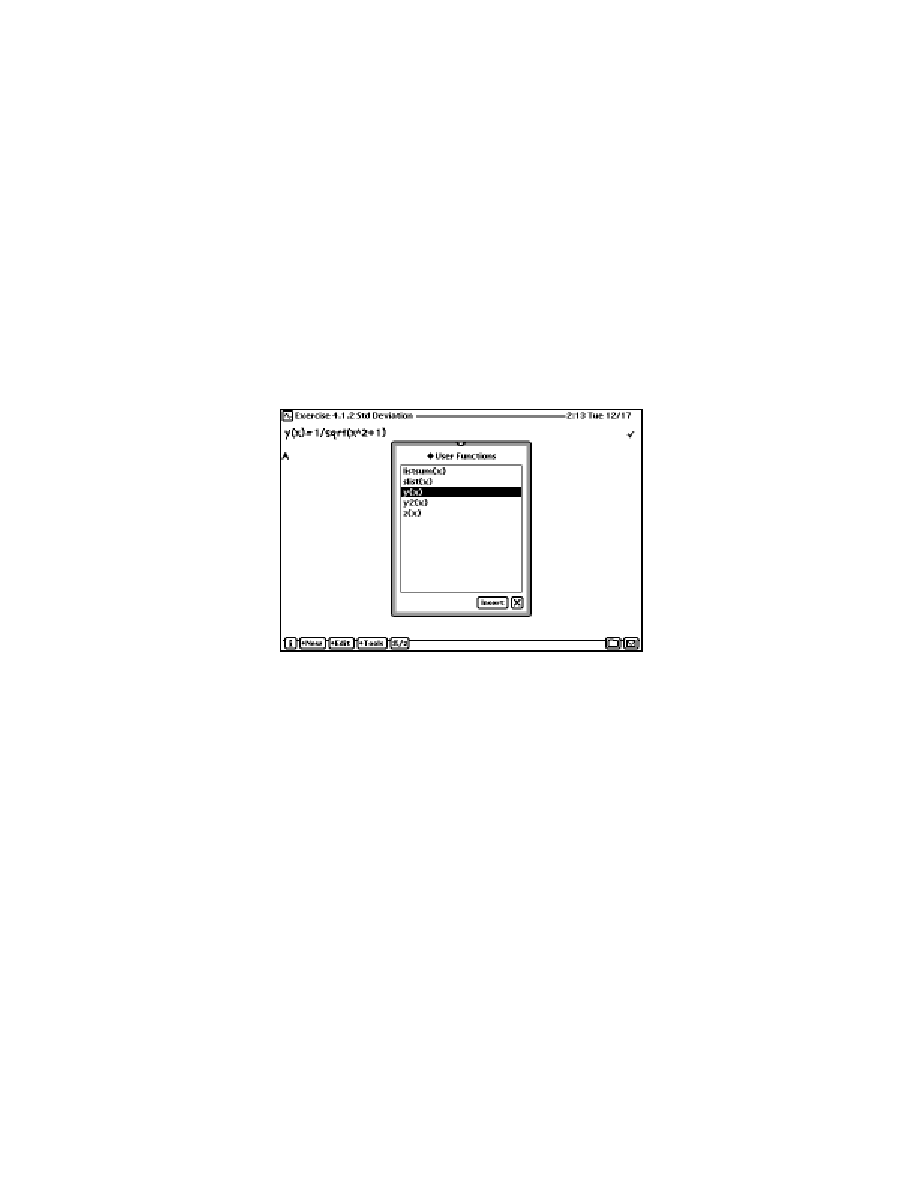
Using your function
To use your function, do one of the following:
m Type the function name on the keyboard, or
1
Tap Tools, and then tap Functions.
2
Tap the diamond
u at the top of the slip, then tap User Functions.
3
Tap the function that you want to use in your calculation, then tap Insert.
The caret is placed between the parentheses.
4
Enter the arguments, if any, for the function.
Using constants
The graphing calculator has four constants defined:
m e
m pi ()
m infinity
m negative infinity
Tip: Pressing Option-P is a shortcut for entering the pi symbol ().
Using Functions and Variables
21
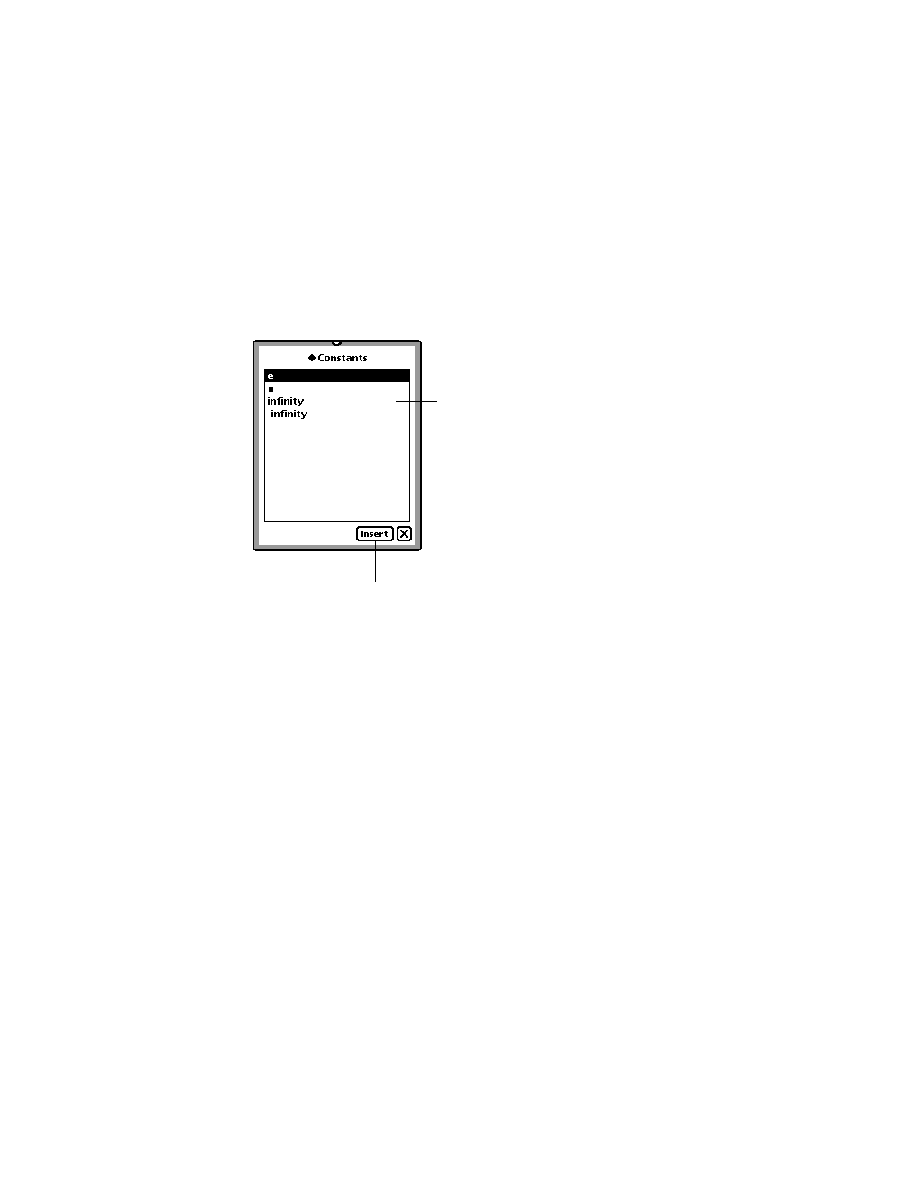
To use these constants, do one of the following:
m Type the function name from the keyboard, or
1
Tap Tools, and then tap Functions.
2
Tap the diamond
u, then tap Constants.
3
In the list that appears, tap the constant that you want to use in your calculation.
4
Tap Insert.
Using variables
A variable can represent a number, an expression, or a list. Variable names are not
case-sensitive, can be up to 255 characters in length, and must begin with a letter.
Variables can consist of other variables. For example,
Dist = High�Low
To define your own variable, follow these steps:
1
Enter the variable name and its value.
Use the format
variable = expression. For example,
myvar = 3
or
myvar = 3+y
22
Chapter 2
Tap the constant you want to use.
When you're finished, tap here to insert the
constant into the math window.
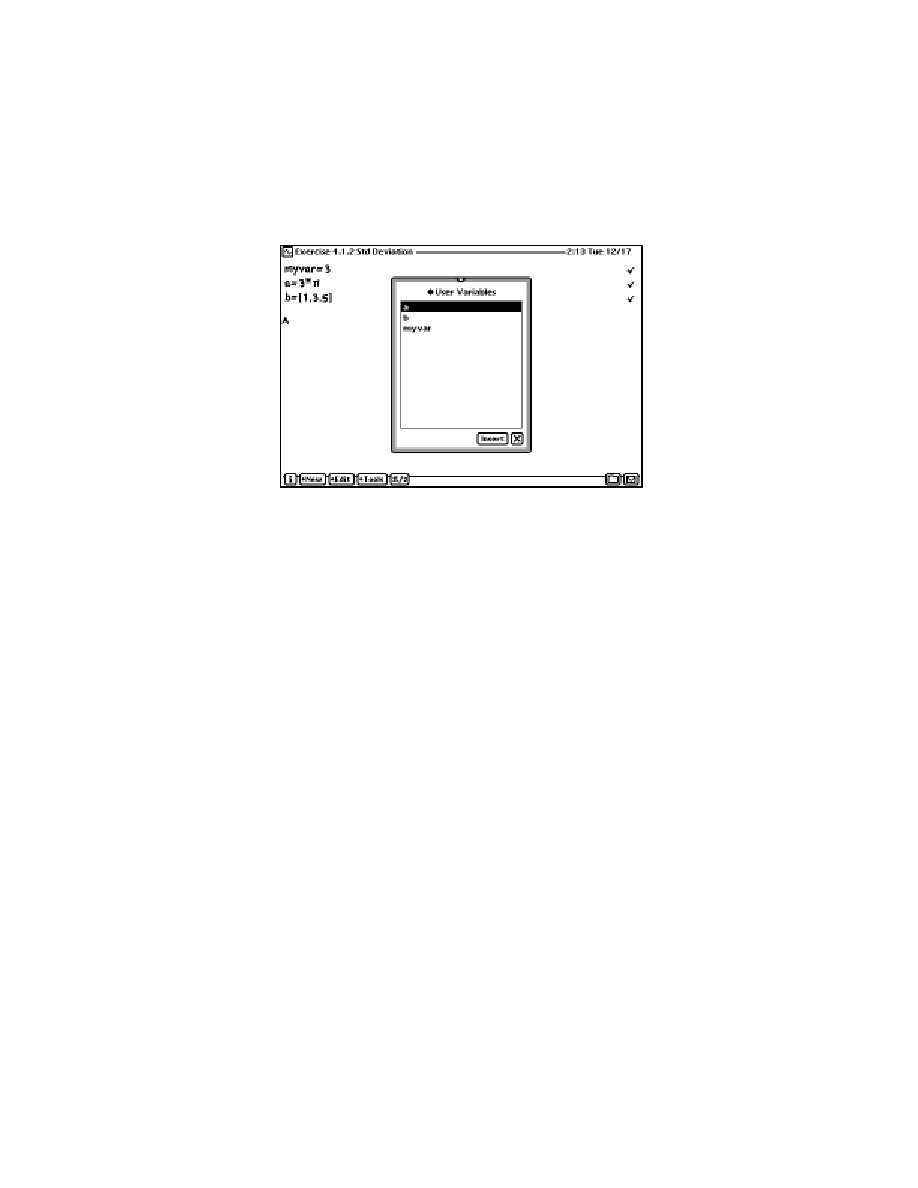
2
Tap Tools, then tap Evaluate (or press Enter).
Your variable is added to the User Variables list.
Displaying the value of a variable
To display the value of a variable, follow these steps:
1
Enter the variable name.
2
Tap Tools, then tap Evaluate (or press Enter).
Changing the value of a variable
To change the value of a variable, follow these steps:
1
Enter the variable name and its new value.
2
Tap Tools, then tap Evaluate (or press Enter or Return).
Graph and table variables
The graphing calculator has some predefined system variables that define the graph
and table views.
Using Functions and Variables
23

The graph variables and their default values are:
Variable name
Definition
Default value
xMin
Minimum x value to display
�12
xMax
Maximum x value to display
12
xScl
Increment between tick marks on the x axis
1
yMin
Minimum y value to display
�12
yMax
Maximum y value to display
12
yScl
Increment between tick marks on the y axis
1
tMin
Minimum value for t in parametric functions
0
tMax
Maximum value for t in parametric functions
99
tStep
Increment between t values
1
thetaMin
Minimum value for
in polar functions
0
thetaMax
Maximum value for
in polar functions
2
thetaStep
Increment between
values
/128
For more information on using these graph variables, see "Changing the Scale of
an Axis" in Chapter 3.
The table variables and their default values are as follows:
Variable name
Definition
Default value
tblStart
Starting value of the table
0
tblDelta
Increment between values
0.1
tblStop
Stopping value of the table
10
These names are not case-sensitive. You can use these system variables in
calculations. You can also change their values and store them.
24
Chapter 2
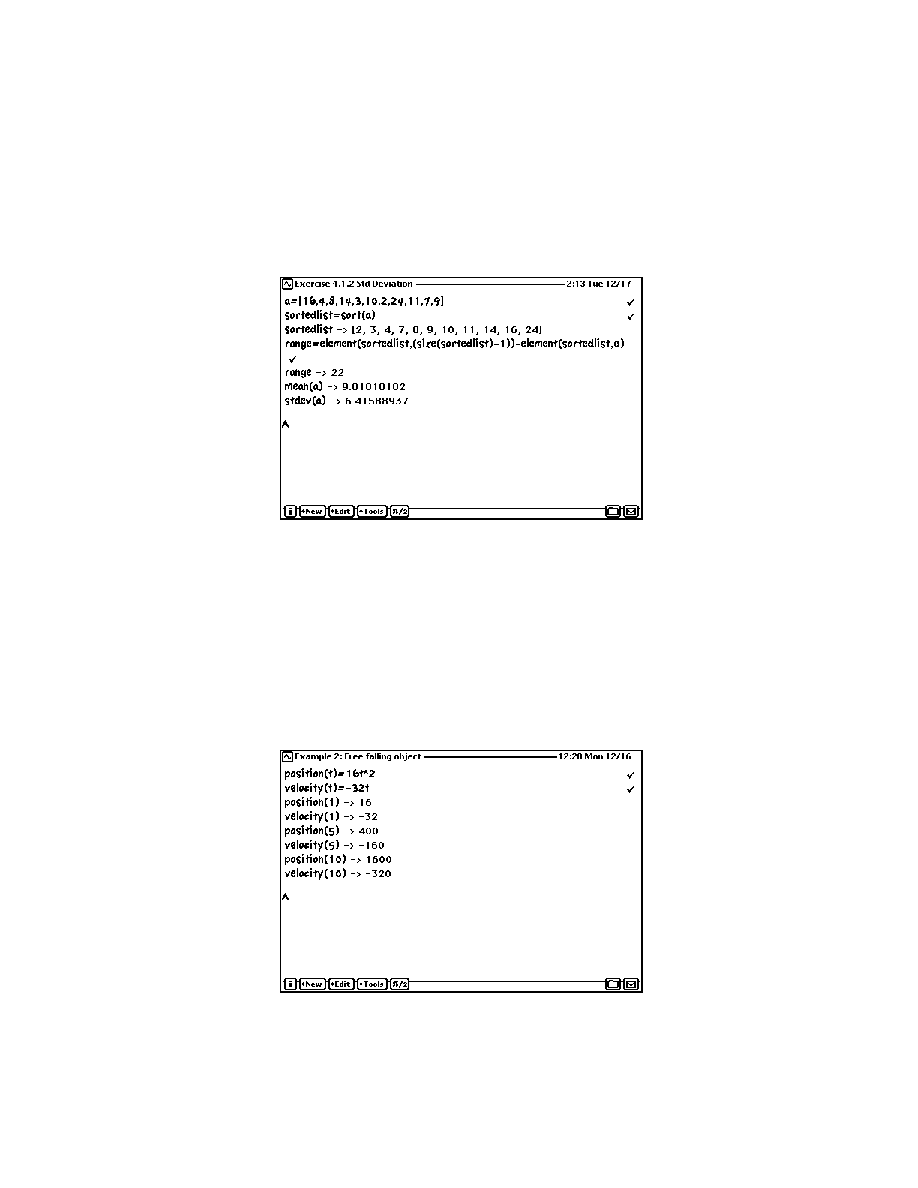
Additional examples
Find the range, mean, and standard deviation of these observations:
16,4,8,14,3,10,2,24,11,7,9
An object is released from rest and falls freely. Calculate its position and velocity after
1, 5, and 10 seconds. Take the origin 0 as the elevation of the starting point, the y-axis
vertical, and the upward direction as positive.
The initial coordinate and initial velocity are both negative. The acceleration is
downward, or �32 ft/s2
position = v0t + .5at
2 = �16t2
velocity = v0 + at = �32t
Using Functions and Variables
25
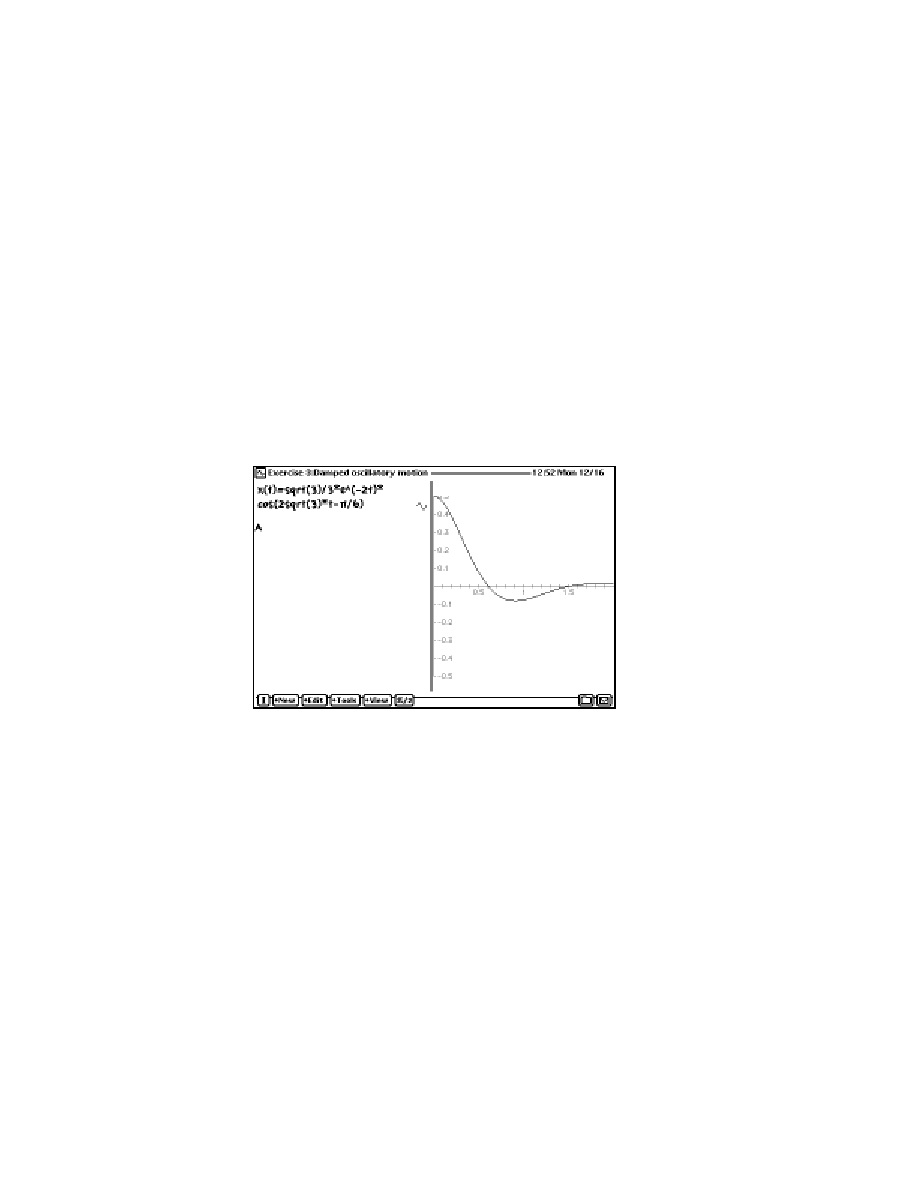
A 32-lb. weight is attached to the lower end of a coil spring suspended from the
ceiling. The weight comes to rest in its equilibrium position, stretching the spring
2 ft. The weight is then pulled down 5 in. below its equilibrium position and released
at t = 0. No external forces are present; but the resistance of the medium in pounds
is equal to 4(dx/dt), where dx/dt is the instantaneous velocity in feet per second. Plot
the damped oscillatory motion.
Using the above information with the basic differential equation for free,
damped motion:
m * d2x/dt2 + a * dx/dt + k * x = 0
Solving for the root and differentiating with respect to t, the solution is:
x = sqrt(3)/3 * e^(�2t) * cos(2sqrt(3) * t �
/6)
26
Chapter 2
Creating Graphs and Tables
27
27
This chapter describes how to plot a function and view results in tabular format.
Creating graphs
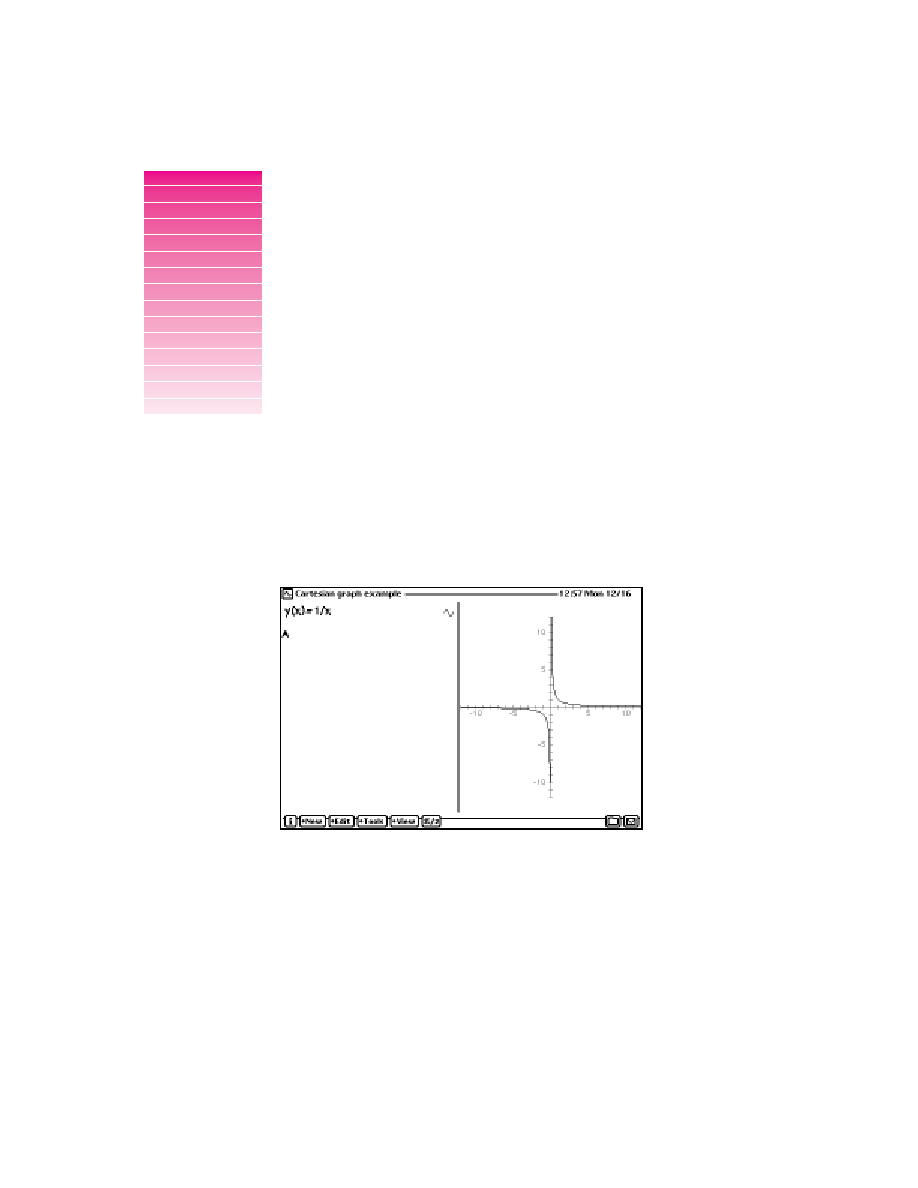
You can create graphs in cartesian (x,y) coordinates:
3
Creating Graphs and Tables
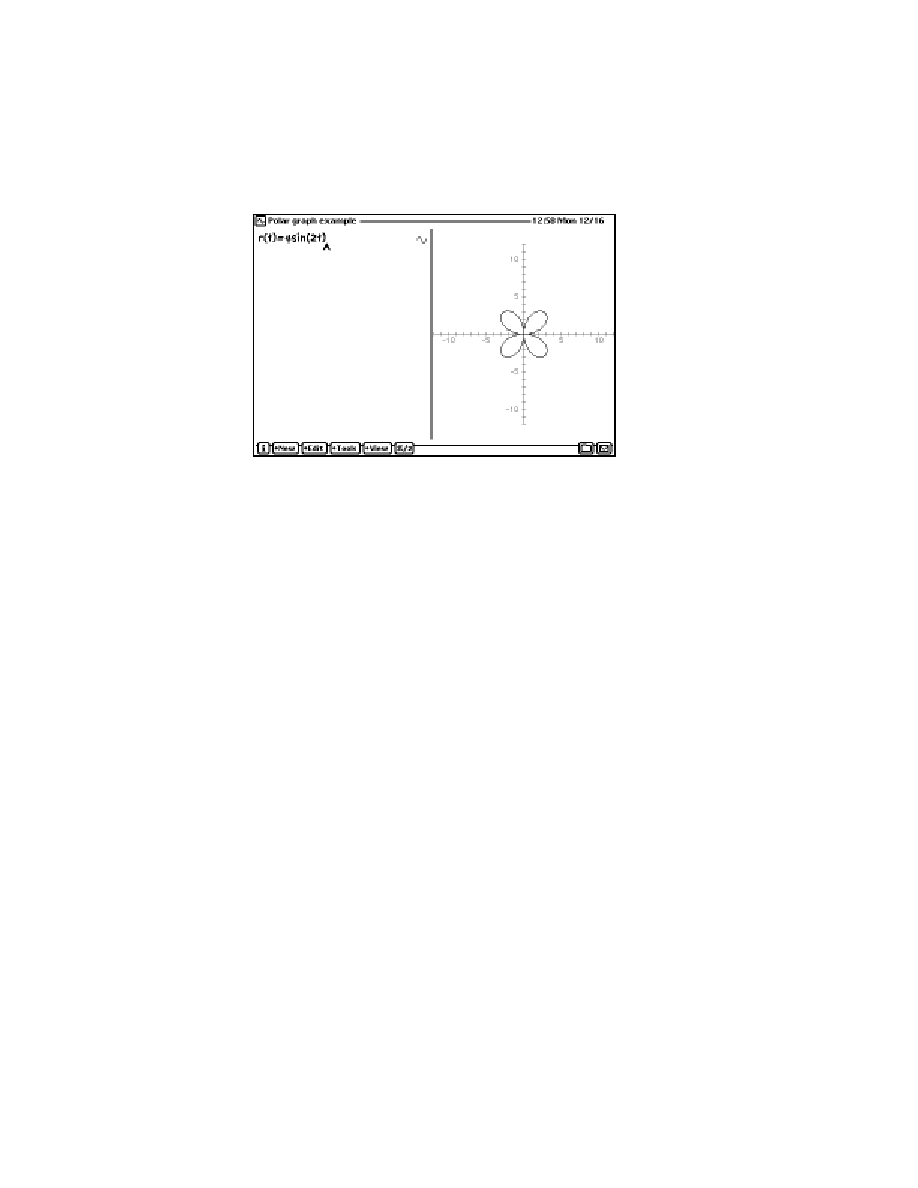
Or polar coordinates:
To plot a function, follow these steps:
1
Create your function.
See "Creating Your Own Functions" in Chapter 2.
2
Position the cursor on the line of the function you want to graph.
3
Tap Tools, then tap Graph or Graph Polar.
A graph of your function appears.
If you change a graphed function in the math window, the graph is updated
automatically after you evaluate the function. If a function is dependent on a variable,
the graph is updated automatically when you change the value of that variable.
28
Chapter 3
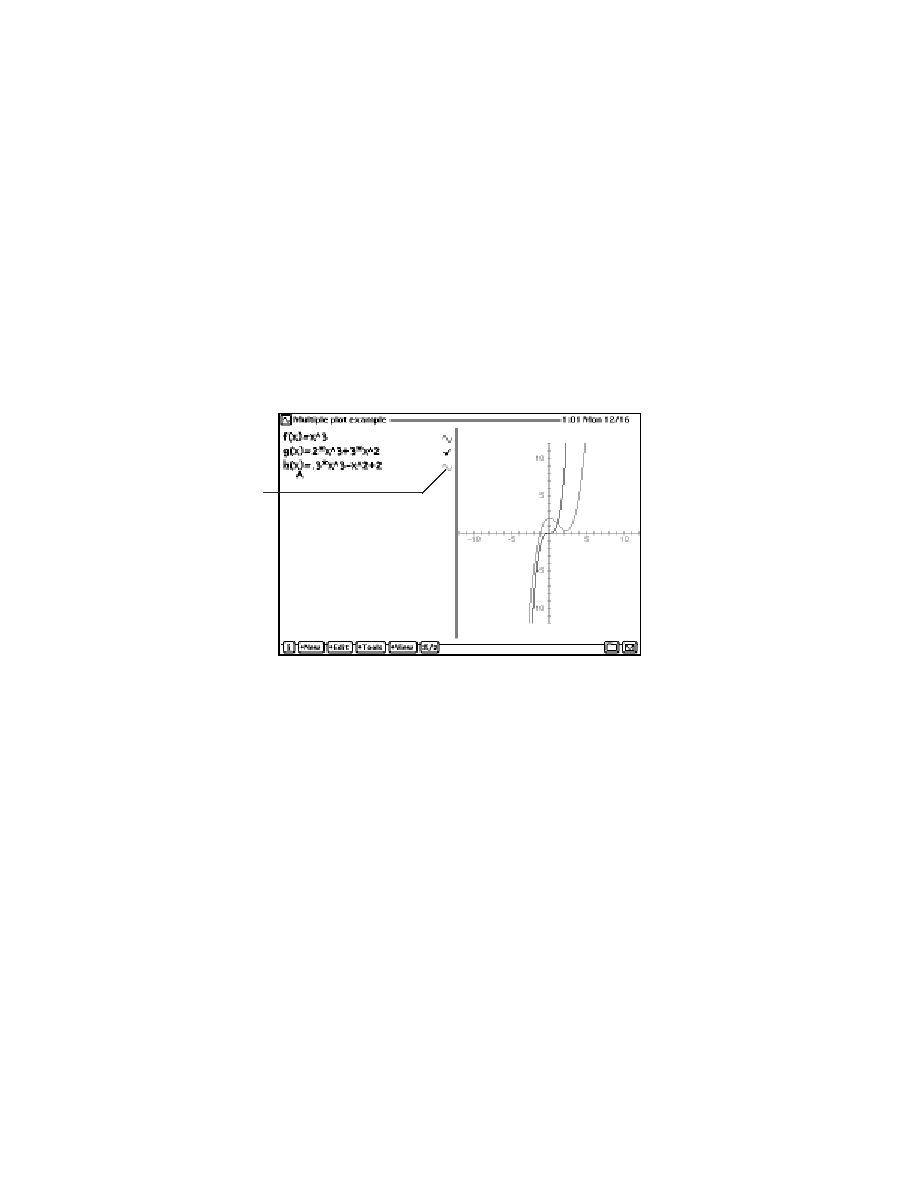
Plotting multiple functions on a graph
You can plot multiple curves on a single graph. The graph icon next to the function
shows the line style used to draw the curve associated with that function.
Note: To plot multiple functions, make sure the functions have different names.
To plot multiple curves, follow these steps:
1
In the math window, move the caret to the function you want to add to the graph.
2
Tap Tools, and then tap Graph or Graph Polar, depending on the graph you already
have displayed.
Creating Graphs and Tables
29
This symbol shows the
line style used in the
graph window for this
function.
Changing the zoom factor
To change the level of detail in your graph, tap View and then tap Zoom In or
Zoom Out.
To zoom in to a particular section of a curve, draw a rectangle around that section.
1
Hold the pen where you want one corner of the rectangle, until you hear a beep.
Note: Make sure the volume on your eMate is turned up so that you can hear the
beep noise.
2
Drag the pen until the section of the graph you want to view is enclosed in
the rectangle.
The other View options are as follows:
m Tap Zoom Full to view the entire graph.
m Tap Zoom Default to set the x and y min and max values to �12 and +12,
respectively.
m Tap Constrain Aspect Ratio to make sure the graph is always square.
m You can also change the zoom factor with the Scale slip. See "Changing the Scale
of an Axis" next.
30
Chapter 3
This rectangle defines the area you
want to zoom in on.
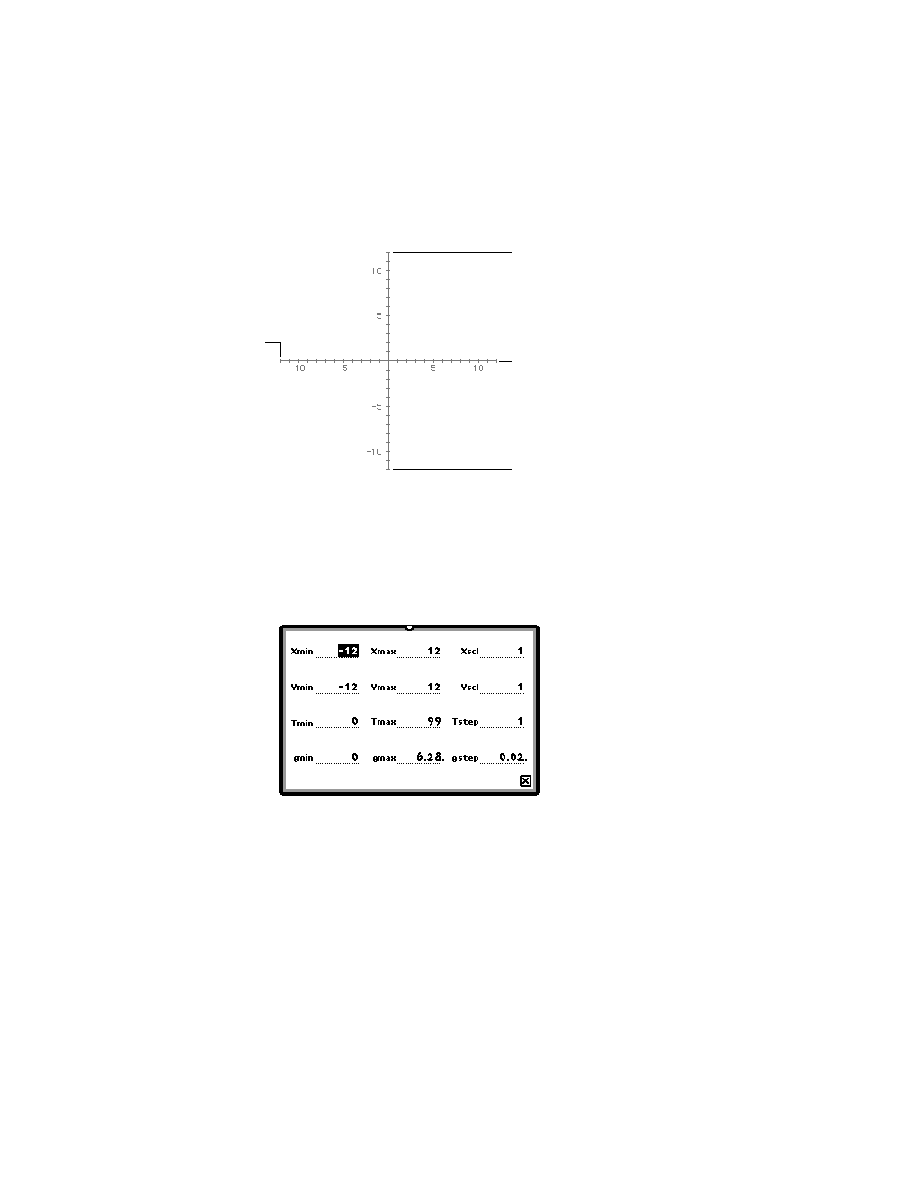
Changing the scale of an axis
The Graph Variables define the scale of the axes for graphs.
You can change these scales by entering new graph variables in the math window or
the Scale slip.
1
Tap View, and then tap Scale.
The Scale slip appears.
Note: xMin must be less than xMax and yMin must be less than yMax.
You can enter expressions with e or
in the Scale slip. For example, you can set
Max = 2.
Creating Graphs and Tables
31
yMax
yMin
xMax
xMin
If xScl or yScl are set to values that would generate too few or too many tick marks on
the graph window, their default values are used.
For more information on these variables, see "Graph and Table Variables" in
the section "Using Variables" in Chapter 2.
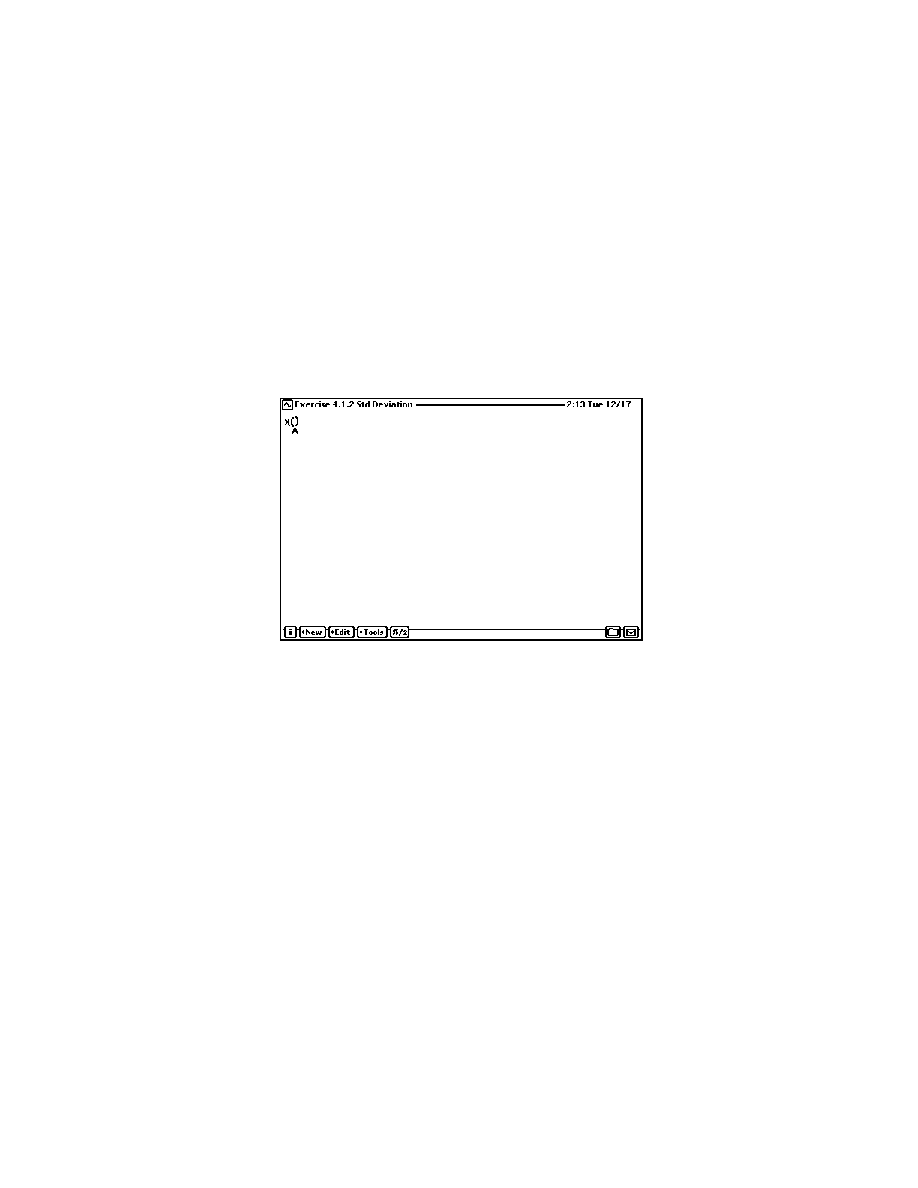
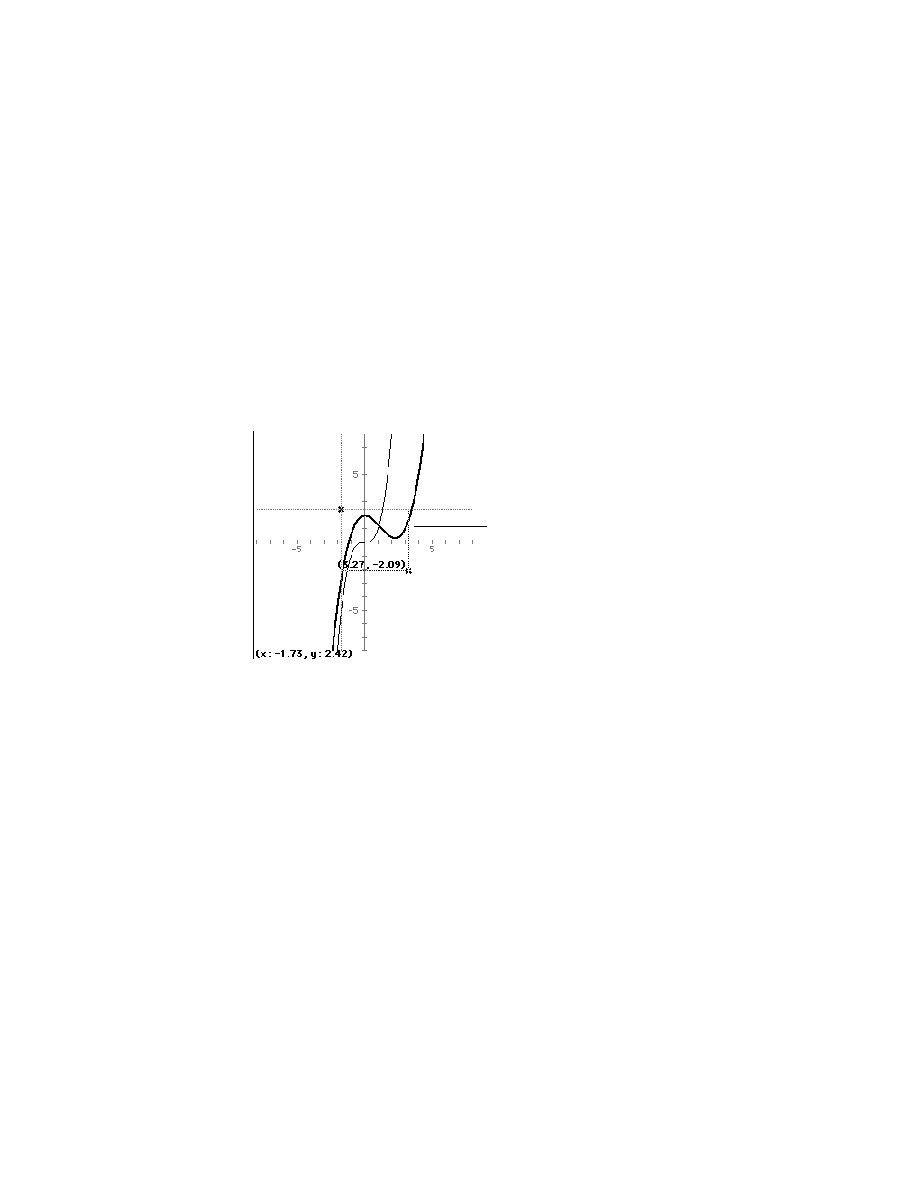
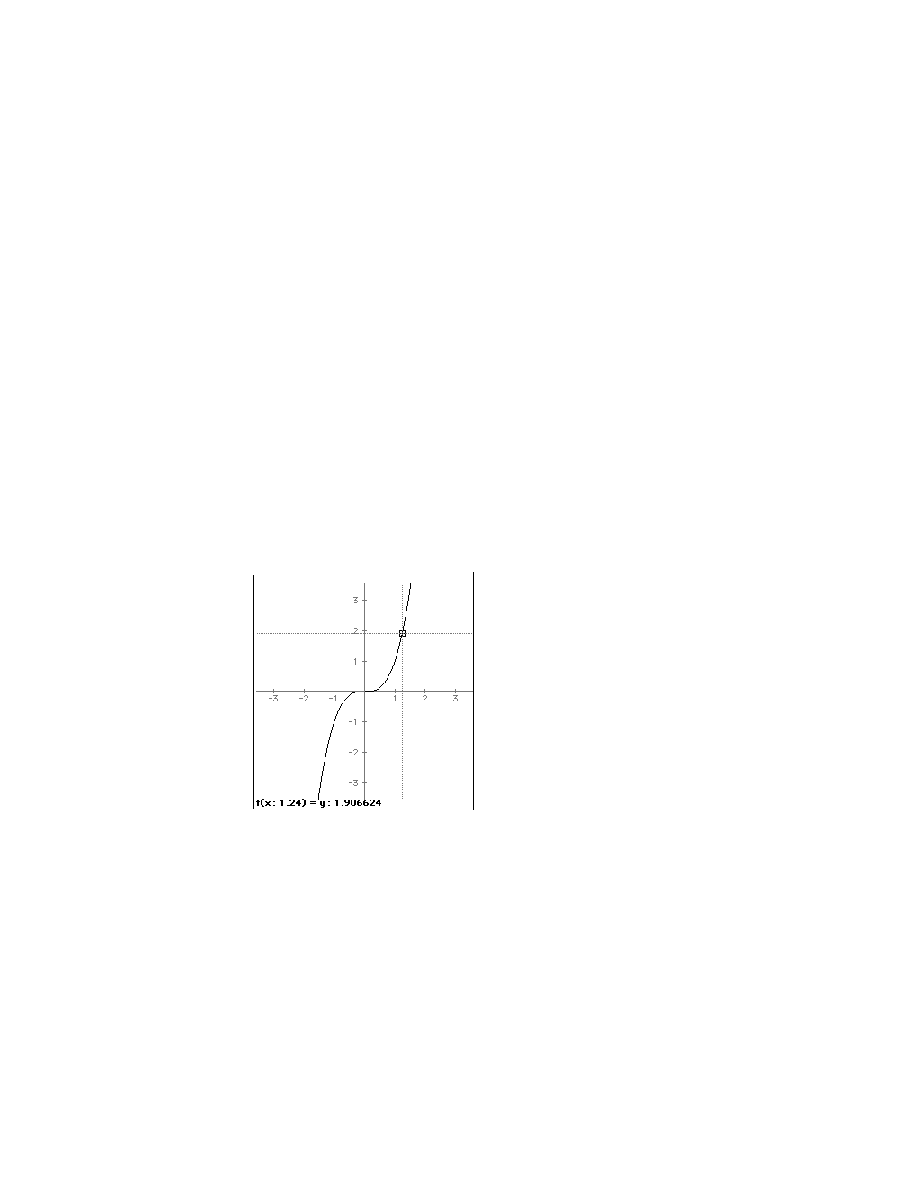
Viewing a point on the graph
Tapping a curve marks that point with a box and displays the (x,y) values of that
point. Use the left and right arrow keys on your keyboard to move the box to the left
and right, respectively. The box will follow the curve of the graph.
To view the (x,y) values of a point that's not on a curve, tap the point. An X appears
and the (x,y) values of that point are displayed.
Hint: If you have problems tapping on a curve, tap above (or below) the curve, then
press the arrow keys on your keyboard to move the point in small increments to the
curve. When it reaches the curve, the X changes to a box.
If you have multiple graphs plotted, you can use the Tab key on your keyboard to
move the point between lines.
32
Chapter 3
Moving around a graph
After tapping a point on a curve (or any point on the graph), you can use the arrow
keys on your keyboard to move around the graph. Pressing the arrow keys while
holding down the Shift or
x key moves the box or X in larger increments.
Closing graphs
To close the graph window:
m Tap Graph, then tap Close Graph.
To remove a curve from the graph, follow these steps:
1
In the math window, tap the function you want to remove from the graph (or tap the
line in the graph window).
2
Tap Graph, then tap Ungraph.
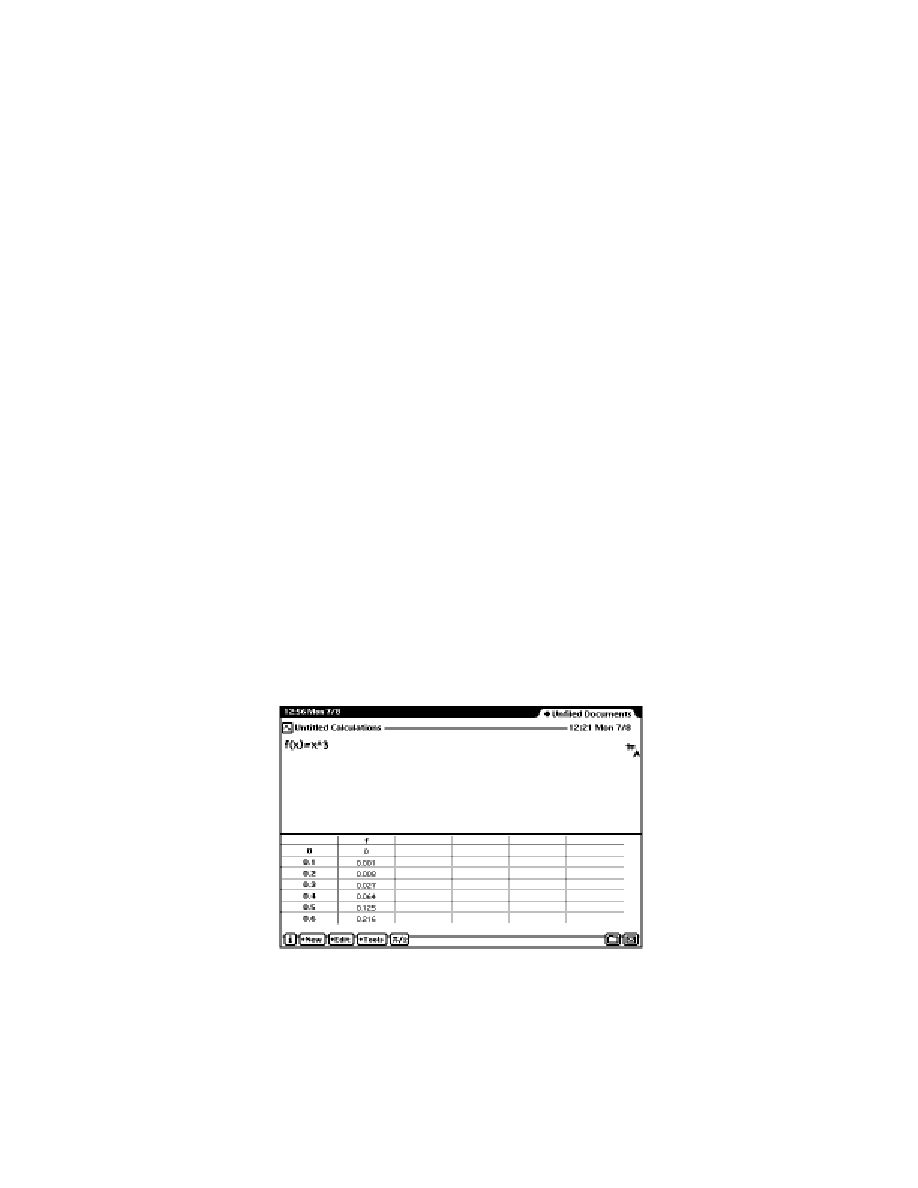
Creating a table
You can display your function in a tabular format.
1
Create your function.
2
Tap Tools, and then tap Table.
A table appears showing the input and output values of your function. An example is
shown below.
Creating Graphs and Tables
33
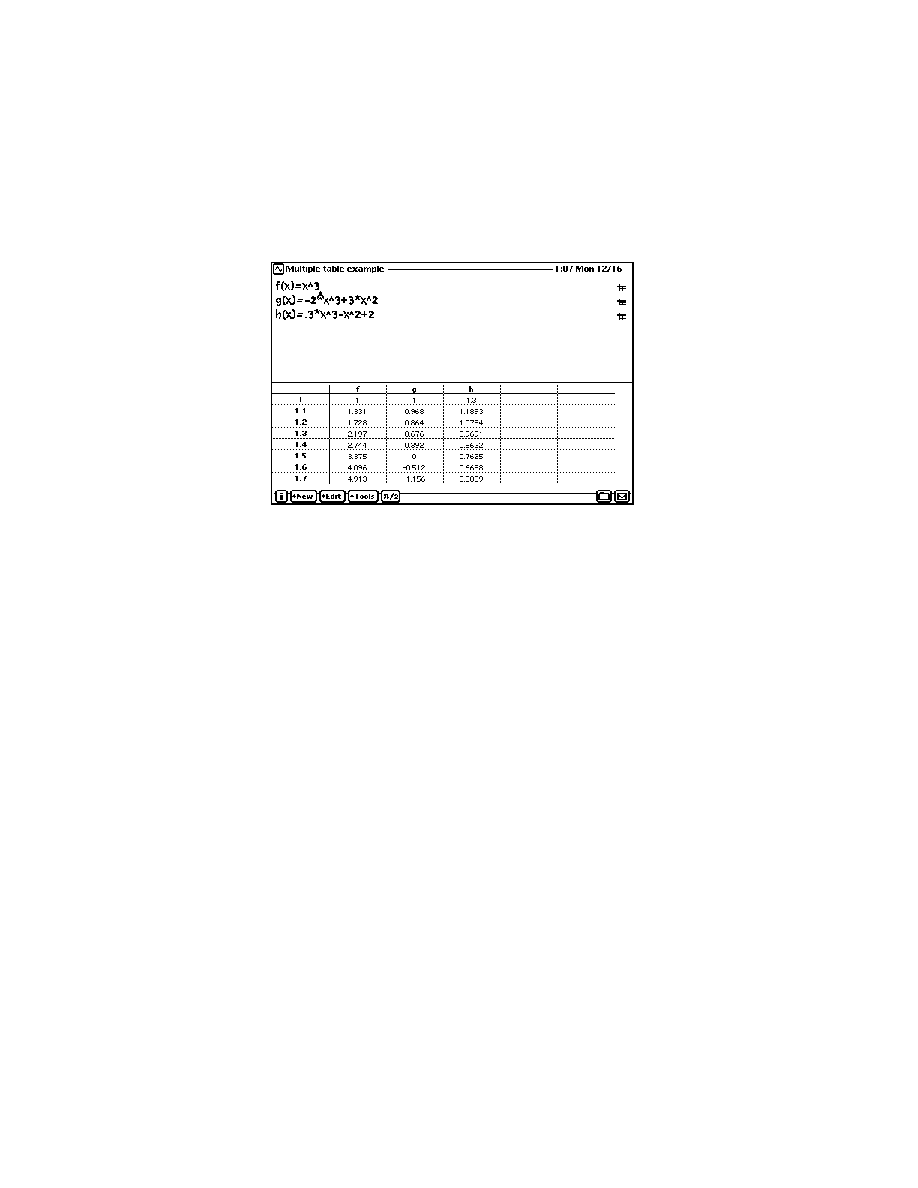
You can display multiple functions in a table.
m In the math window, move the caret to the function you want to add to the table.
Tap Tools, and then tap Table.
Moving through the table
To scroll through a table, tap any entry in the table and press the Up or Down Arrow
keys on your keyboard. Pressing the arrow keys while holding down the
x key moves
in larger increments. Press the Left or Right Arrow keys to move from one function to
the next.
34
Chapter 3
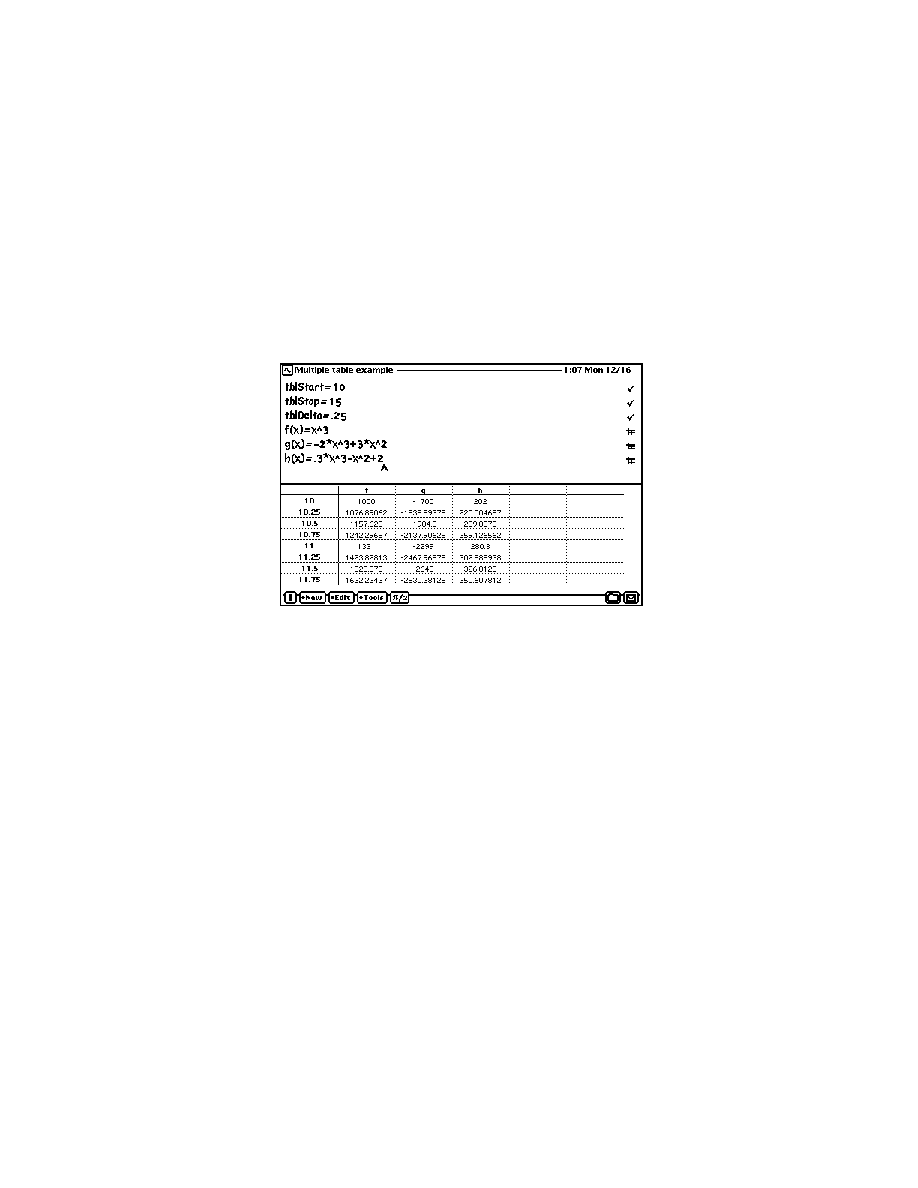
Changing the table scale
The tblStart, tblStop, and tblDelta system variables define the initial table view. You
can change these variables in the math window. For example:
tblStart=10
tblStop=15
tblDelta=.25
Note: tblStop is used only in printing or copy-and-drag operations. You can scroll
beyond the tblStart and tblStop values in the table window.
Closing a table
To close the table window:
m Tap Tools, then tap Close Table.
To remove a function from the table, follow these steps:
1
In the math window, tap the function you want to remove from the table.
2
Tap Tools, then tap Untable.
Creating Graphs and Tables
35


37
You can use lists to provide values for function arguments and to store and
manipulate data. This chapter describes how to create and use lists in your
calculations and functions.
Creating lists
To create a list, type a series of numbers separated by commas and enclosed in
square brackets. You can enclose lists within lists and place functions in lists. The
following are examples of lists:
[1,2,3,4,5]
[1,2,[3,4]]
[1,2,x^2,sin(x)]
4
Creating and Using Lists

Performing operations on lists
You can perform any operation on a list of numbers. If multiple lists are used in an
operation, they must be the same length. The following are some examples of simple
operations done with lists:
Operation
Example
Result
Addition
[1,2] + 3
[4,5]
[1,2] + [3,4]
[4,6]
3 + [1,2,[3,4]]
[4,5,[6,7]]
Subtraction
[1,7,1] � [2,3,1]
[�1,4,0]
[6,7] � 3
[3,4]
Multiplication
3 * [4,5]
[20,25]
[1,2,[3,4]] * [4,5,6]
[4,10,[18,24]]
Division
[3,4,5]/2
[1.5,2,2.5]
[4,5,6]/[2,3,4]
[2,1.6667,1.5]
Simple functions
[2,3]^2
[4,9]
log([1,10])
[0,1]
The above functions perform operations on each element in the list. Other functions
perform operations on the entire list--for example sum([list]). For more information
on lists and functions, see Chapter 2, "Using Functions and Variables."
Using variables with lists
You can assign a list to a variable and perform operations on that variable.
For example:
a=[1,2,[3,4]]
3+a -> [4,5,[6,7]]
For more information on variables, see "Using Variables" in Chapter 2.
38
Chapter 4
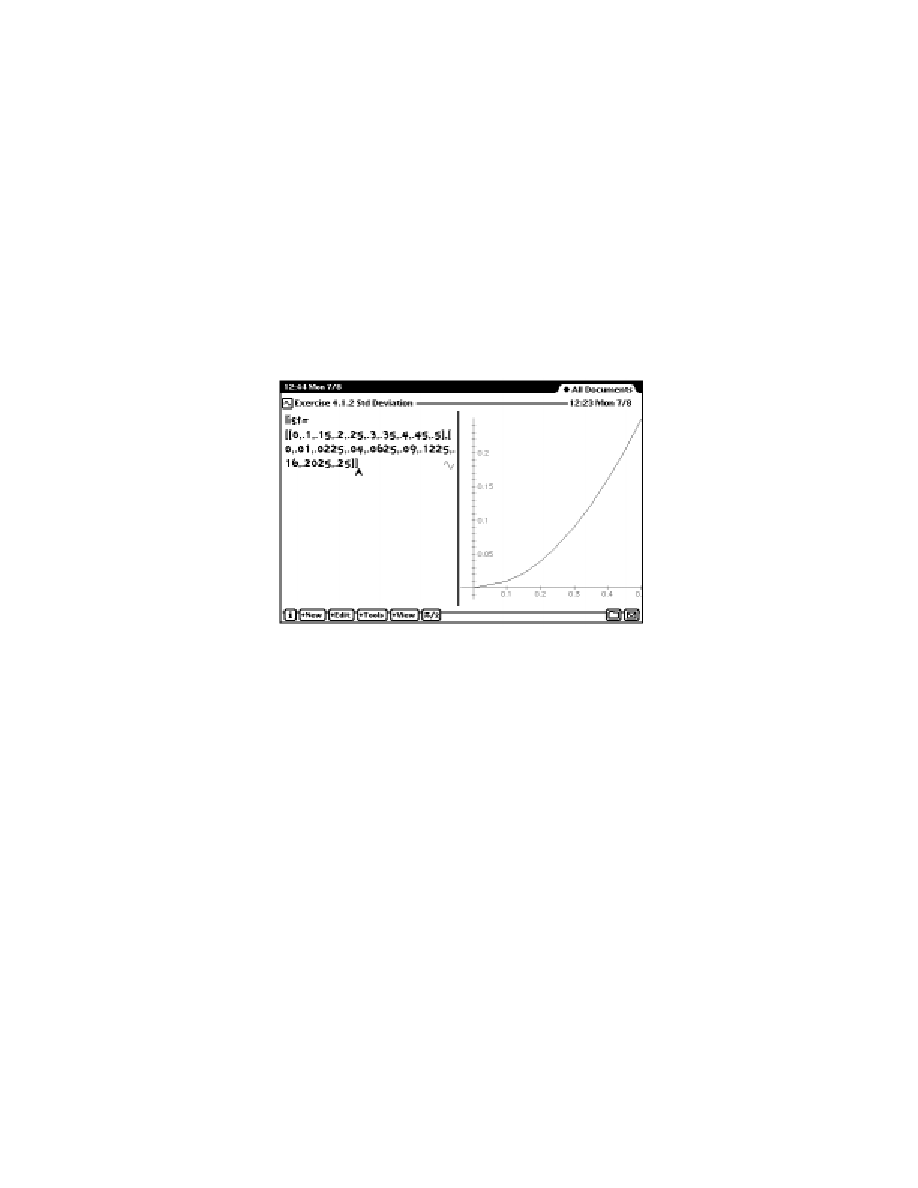
Graphing lists
You can use lists to graph a family of curves. Use one of the following formats for
the list:
m [[x1,y1,x2,y2,x3,y3...]
m [[x1,y1],[x2,y2],[x3,y3],...]
m [[x1,x2,x3,...],[y1,y2,y3,...]]
An example is shown below:
An advantage of the format [[x1,x2,x3,...],[y1,y2,y3,...]] is that you can perform
operations on the x and y coordinates independently.
The following example shifts the graph to the right (shifts the x coordinates) by
10 units:
list1=[[0,1,2,3,4],[5,6,7,8,9]]
list2=list1+[10,0] -> [[10,11,12,13,14],[5,6,7,8,9]]
Creating and Using Lists
39

Newton Works
Graphing Calculator
User's Manual

K Apple Computer, Inc.
�
1997 Apple Computer, Inc. All rights reserved.
1 Infinite Loop
Cupertino, CA 95014-2084
408-996-1010
http://www.apple.com
Every effort has been made to ensure that the information in this manual is accurate. Apple is not responsible for
printing or clerical errors.
Apple, the Apple logo, the Light bulb logo, Macintosh, and Newton are trademarks of Apple Computer, Inc.,
registered in the U.S. and other countries
eMate is a trademark of Apple Computer, Inc.
Adobe, Adobe Illustrator, Adobe Photoshop, and PostScript are trademarks of Adobe Systems Incorporated,
which may be registered in certain jurisdictions.
Helvetica is a registered trademark of Linotype-Hell AG and/or its subsidiaries.
Simultaneously published in the United States and Canada.
Mention of third-party products is for informational purposes only and constitutes neither an endorsement nor a
recommendation. Apple assumes no responsibility with regard to the performance or use of these products.

Contents
1
Introduction 1
Creating a new document for calculations 1
Setting preferences 3
Using operators 5
Order of evaluation 6
Viewing the results 7
Correcting mistakes 7
Clearing the display 7
Saving a calculation document 8
Filing a calculation document 8
Viewing your calculation documents 9
Printing, beaming, and faxing 9
Reinstalling the Newton Works graphing calculator software 9
2
Using Functions and Variables 11
Using the built-in functions 11
Creating your own functions 18
Using constants 21
Using variables 22
Additional examples 25
iii

3
Creating Graphs and Tables 27
Creating graphs 27
Creating a table 33
4
Creating and Using Lists 37
Creating lists 37
Performing operations on lists 38
Using variables with lists 38
Graphing lists 39
iv
Contents
© 2007-2024, o7 studio » при воспроизведении материала сайта ссылка обязательна
